A cynic once observed that normal is a place one passes going from one extreme to another. They must have just been studying the history of interest rates. ACR does not forecast interest rates because we do not think we can. The macroeconomic dynamics are too complex, confirmed by historical interest rate volatility. Forecasting interest rates, however, is different from anticipating the future of interest rates. In this quarter’s commentary, we survey interest rate history, discuss the key economic drivers of rates, and suggest policies for navigating future interest rate and inflation uncertainty.
Interest rates are an expansive topic because they are one of two foundational determinants of asset values, the other being investment cash flows. Therefore, this quarter’s commentary is more like a white paper. For the two-page version, read section I, skip section II, and read only the six one-sentence policy prescriptions listed in section III (beginning on page six).
I. A Brief History of Interest Rates
Over the past 50 years, the yield on the 10-year US treasury has ranged from over 15% in 1981 to less than 1% in 2020. The past two years have proven that interest rates are not a one-way ticket lower. After hitting bottom in 2020, the 10-year has risen to nearly 5%. Market participants in the early 1980s might have been forgiven for assuming just the opposite – that interest rates were a one-way ticket higher. The 10-year Treasury yield was around 2% in the mid-1950s before ascending to its historic peak. Below is a history of US treasury yields and inflation.

Given these extremes, is there an average which might be considered “normal?” The average monthly yield on the 10-year treasury since 1953 was 5.6%. With inflation running 3.5% over this period, the real yield (reduced by inflation) was approximately 2%. The problem with this historical average real yield, sometimes cited in forecasts, is it gives little indication of what one might earn over a sensible investment horizon. A step further back in history is necessary to fully appreciate the potential range of outcomes.
Our capital protection credo at ACR includes protecting from the “100-year economic flood”. This requires looking at the long history of economic calamities to see what lessons they may hold for us today. Date range inclusion for any series is as much art as science. Everything from political and economic regime to data quality must be considered. For US equity and debt, we believe data series going back to the 1920s are most useful for our purposes.1 Importantly, this period includes the Great Depression and WWII, quintessential US examples of 100-year economic floods. The table below is based on real US Treasury yields from 1926-2022.
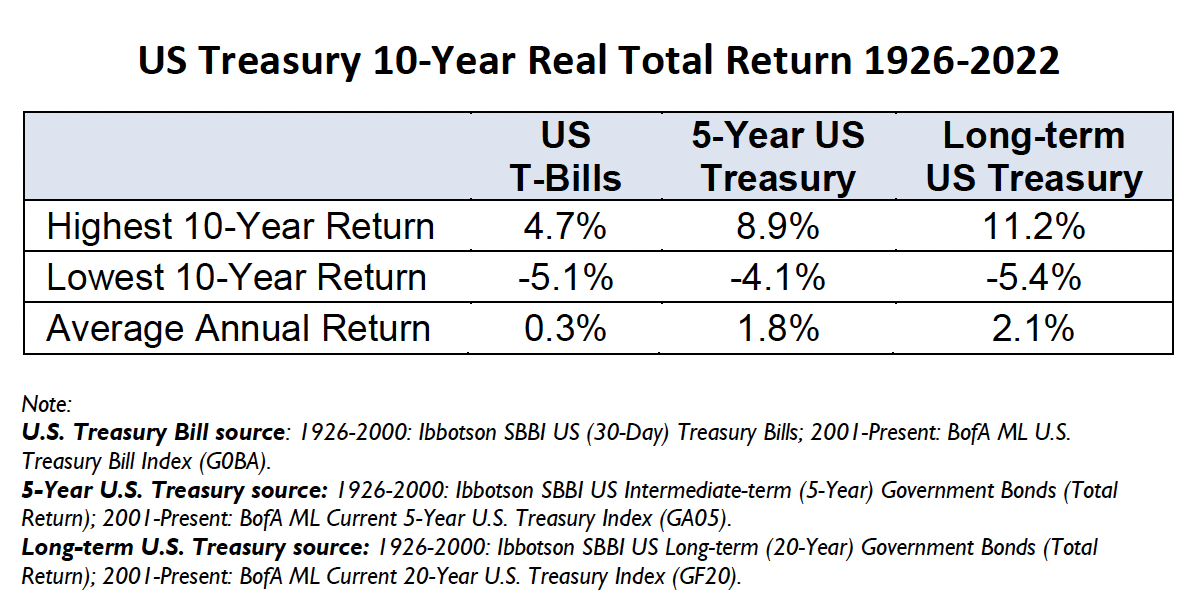
The lowest 10-year return is for many investors shockingly bad, especially for those relying on a fixed income. Unfortunately, history offers a disconcerting illustration of the losses possible from investing in the highest quality bills and bonds in the world. Strategies for mitigating these outcomes are presented in section III.
II. Key Economic Drivers of Interest Rates
An examination of the key economic drivers of interest rates helps explain the historical volatility. Before proceeding, please note that our explanation is based in some parts on fact, and in others on opinion, which we always attempt to distinguish.
Interest rates in modern economies are largely established by central banks and expectations of real economic activity and inflation. In the US, the Federal Reserve (“the Fed”) establishes key rates, primarily the short-term Fed Funds Rate. While the specific tools have changed in recent years, with the
introduction of interest on Fed Funds and the purchase of long-term securities,2 the defining mechanism and goals of Fed monetary policy have been the same for some time. The Fed raises rates to cool economic activity and inflation, and it lowers rates to stimulate economic activity and employment.
The Fed had a very long runway of lowering rates beginning in the early 1980s. In our opinion, they began to think too much of their monetary powers. Witness how the Fed missed the extent of building economic fragility that culminated in the Great Financial Crisis (GFC). The response to the GFC was predictably to lower rates. Reducing rates is not necessarily the wrong response. The real issue, as we see it, is to understand at what rate level monetary policy becomes ineffective. We suspect somewhere in the low single digits. Regardless, it is difficult to go much below zero.
The Fed initiated a zero interest rate policy (ZIRP) during the GFC in 2008, which it maintained until 2016, and resumed again from 2020-2022. They also implemented quantitative easing (QE) beginning in 2008, the purchase of treasury and mortgage securities, initially to put a floor under collapsing asset prices, later to help reduce long-term rates for additional stimulus. Neither ZIRP nor QE, in our opinion, did much to stimulate growth, though others may disagree. Growth proved anemic coming out of the GFC, rather than the strong bounce one might expect from a significant downturn. We believe an even more convincing case for monetary policy impotency can be made in Europe and Japan. The European Central Bank (ECB) experimented with negative rates while the Japanese central bank dramatically expanded its balance sheet to include all manner of assets, including equities. Their reward? Continued anemic growth.
Nor did ZIRP and much-criticized central bank “money printing” lead to the massive inflation so many pundits and economists had predicted for so long. The imposition of zero rates and creation of excess reserves does not lead to economic growth or inflationary pressures if the funds never make it into the real economy via goods and services production and consumption. However, ZIRP did, in our opinion, stimulate inflation of another sort.
Asset prices rebounded after the GFC and kept rising in a historic bull market across all major asset classes. It is a mathematical axiom that fixed income asset prices move inversely with rates, and bond prices didn’t stop rising until the 2020 rate bottom. Low rates do not necessarily translate into higher equity prices (see Japan). Yet in the US, ZIRP seems to have caused TINA – “there is no alternative” to low rates other than equities and other riskier assets. We have quantified and spoken extensively about the rise in public equity market prices in relation to underlying corporate earnings in the back half of the 2010s. Debt leverage is a staple of real estate and private equity returns, so low rates naturally boosted asset prices in these markets. In section III we will address how to protect and profit from losses in markets which remain vulnerable to higher rates and potential further price declines.
Central bank and investor expectations of real economic activity and inflation are muddied by disagreement over key determinants. A discussion of these differences is beyond the scope of this commentary. Regardless of competing theories, however, most would agree that inflation will rise when demand exceeds all available supply. When the pandemic broke in early 2020, demand immediately collapsed, and unemployment skyrocketed. The US government responded with the greatest fiscal spending program since WWII. In our view, it is difficult to deny that this massive fiscal response, rather than central bank monetary policy, ultimately resulted in the prevention of a depression, robust economic growth, and eventually inflation.
Disagreement remains about how much pandemic-induced supply constraints or overzealous fiscal spending caused the recent spike in inflation, but either way Fed policy abruptly shifted to stamping out rising goods and services prices by raising short-term interest rates. In addition, the Fed initiated a policy of quantitative tightening (QT), the unwinding of QE. QT presently refers to letting treasury and mortgage securities mature rather than replacing them with new purchases. This reduces the size of the Fed’s balance sheet and supply of central bank reserves while putting upward pressure on rates. Yet by far the main driver of rising rates has been inflation expectations with high-grade corporate bonds now over 6%, 30-year mortgage securities touching 8%, and junk bonds over 9%.
The unpredictability inherent in economic activities and policies, and their interactions, confirms why rates and inflation have varied so widely. The future of interest rates is in our view uncertain because the determinants of rates are uncertain. Yet there are various guideposts that can help illuminate a path toward sound investment policies. For example, the Fed’s response to inflation in excess of 2% is relatively clear today, whereas we believe their response to disinflation is less clear. Fed policy is to raise rates to reduce inflation to 2%, at least once it determines inflation is a problem. Unfortunately, raising rates to reduce inflation is a blunt tool likely to cause recession unless wielded with precision – a very tall order. The jury is still out on that score today.
Ultimately, we believe monetary policy is capable of reducing inflation, and the Fed will orchestrate a higher real rate as a means to do so. We think of this as the spread theory of rates and inflation. As inflation rises so eventually will rates. For example, the rise in mortgage rates was preceded by an increase in housing prices and wages which in some part offset the rate increase. Production volume and the real rate of interest are what matter most, in a world where rising nominal rates broadly, but far from perfectly, keep pace with nominal price increases.
Fed policy appears less clear under disinflationary conditions. ZIRP is relatively new. Will the Fed return to ZIRP during the next recession? Or have they learned that ZIRP and long-term bond purchases may be better at distorting asset prices than stimulating demand? Our macroeconomic advisor, Professor Steve Fazzari, believes fiscal policy can be intelligently targeted to stimulate growth without necessarily causing a long-term increase in Debt/GDP.3 New ideas and solutions are needed when the economy is inordinately weak. We can only hope that the Fed will admit the limitations inherent in their monetary policy toolbelt when the time comes.
We conclude this section with a 4-point framework for describing key asset yield drivers and the potential future of interest rates. The underlying assumption is a reasonably well functioning free enterprise system. All bets are off under dysfunctional political and economic systems and failed regimes. This may bring to mind the US government today, with its inability, for example, to elect a house speaker last month. The US is far from perfect, but geopolitically and economically, we remain a bastion of strength. We are nowhere near the kind of state in which free enterprise economic dynamics fail to deliver innovation and prosperity. Let us count our lucky stars in this regard.
Key drivers of asset yields and the potential future of interest rates in today’s functioning free enterprise economies:
1) Real yields on government debt are largely what the central bank and government want them to be. Prolonged negative real returns on government debt largely occurred in the post-WWII years as the economy transitioned from war to peace time. Rates were not raised during this period to compensate for inflation. While this specific scenario is unlikely, negative real yields are possible under other circumstances and policies. For example, anemic growth and a Fed return to ZIRP at low inflation rates could result perennial negative real yields. While unlikely, we must consider the possibility. Overall, we expect a near zero real yield on short-term government debt based on central bank mandates for price stability but would be prepared for worse.
2) Real yields on long-term government debt are largely what the central bank and government want them to be, along with the premium investors require for term risk. Developed market central banks seem to be comfortable with QE/QT, so there is reason to believe central bank influence on long-term rates could be here to stay. Should the bias remain toward a permanently larger central bank balance sheet comprised of long-term securities, the term premium on long-term debt could remain somewhat repressed. Again, not a prediction, but possible. Overall, we would expect a real yield on long-term government debt of 1-2% based on central bank mandates for price stability but would be prepared for worse.
3) Real yields on corporate and other forms of non-government debt will contain a risk premium for credit risk in well-functioning capital markets. The question is if negative real yields on government debt persist someday, to what extent would they be transmitted into credit markets? In the recent past, while a credit spread remained, overall riskier debt yields declined with government debt yields as expected. Our working assumption, if real government debt yields remain slightly positive, is the continuation of a sensible credit spread and overall yield offering opportunity in individual securities. We would also expect credit yields and spreads that drift too low during more optimistic expansionary periods, and inordinately high yield spikes during panics, thus creating cyclical opportunities.
4) Real yields on equity will contain a risk premium for earnings variability in well-functioning capital markets. Investors and economists disagree about whether equities are a hedge against inflation. We believe equites are a hedge against inflation in the long-term and have discussed this topic extensively in past commentaries (see Inflation, Markets, and Returns). Equities are the only potential solution to policy-inflicted negative real bond yields. Equity prices, however, must be reasonable enough to compensate for the risk of overpaying for unpredictable and disappointing equity earnings.
III. Investment Strategy under Interest Rate and Inflation Uncertainty
Our policies for investing under interest rate and inflation uncertainty are simple and rooted in fundamental investment principles. Execution is the hard part. Most conventional asset allocation frameworks render implementation difficult at best. Requirements include unorthodox policies, extraordinary discipline, and opportunistic flexibility. These are our opinions, others may disagree.
1) Avoid long-term fixed income investments at rates well below historical averages.
We first warned of the perils of low long-term rates in our 2nd quarter 2013 commentary, The Low Rate, High Profit Value Mirage.
Interest rates are a different story. They may be at historic lows, but what happens when they rise? The recent small bounce in rates and attendant decline in bond and stock prices is a small harbinger of what is likely to happen when a more enduring increase takes hold. Note that bond prices should remain permanently lower given rising rates, but stock prices are likely to be buoyed by longer term economic growth and therefore should face more of a headwind than a permanent decline.
While we may know the outcome of rising rates, we have no idea of the timing, whether tomorrow or in twenty years. Still, we want to protect our client capital. Protection from rising rates requires avoidance of companies with excessive short-term debt or financial institutions that borrow short and lend long. Financial firms that hold long-term loans at historically low rates and borrow at short-term rates are vulnerable. In the EQR portfolio, our industrial companies have limited debt, and our financials should generally benefit from rising rates due to their diverse business lines and asset/liability mix.
While it took 10 years for rates to finally rise, investors who avoided long-term bonds in 2013 didn’t miss much. The 10-year yield started 2013 at 1.7% and ended the year at 3.0%. While better than 0% T-Bills, equity markets were offering better long-term returns.
Unfortunately, many regional banks did make “long-term loans at historically low rates and borrow[ed] at short-term rates,” which precipitated the regional banking crisis earlier this year. The story here may not be finished. The longer that short-term rates stay high, the more likely banks, real estate investors, and private equity sponsors who invested long-term and borrowed short-term at inadequate spreads will come into trouble. Imprudence of this sort is likely to provide opportunities for our credit team.
The debt-related risk embedded in our equity portfolio companies remains relatively low, much as it was ten years ago. Our portfolio companies continue to maintain on average higher
investment grade debt levels and term structures, and our financials continue to be very well positioned for rising yields. ACR’s property & casualty insurance companies are almost entirely void of long-term bonds, and our money center banks are insulated from the duration risks posed by many regional banks due to their “diverse business lines and asset/liability mix”.
2) Employ high-grade fixed income investments for liquidity.
Investors with regular fixed spending needs that exceed dividends and interest require sufficient liquidity when equity portfolio sales are not advisable. Investors cannot of course expect to realize equity gains every year. Worse, gains may run dry for several years during secular bear markets. High-grade fixed income with a proper term structure is an essential source of liquidity to assure spending needs are met when equity prices are depressed.
Now that rates are higher, investors are likely to think of fixed investments as a source of income again. While the additional interest is a welcome bonus post ZIRP, a mistake many fixed income investors make is to think in nominal rather than real terms. Investors wishing to preserve value relative to inflation must think in real terms. Unlike equity yields, which are in effect real when companies are able to raise prices with costs, fixed income investors must reduce their expected nominal yield by inflation to compare equity and fixed yields on an apples-to-apples basis. Inflation adjustment significantly reduces the real spendable income from fixed income.
Optimistically, we believe the real return on high grade fixed income could average 2% per year. However, our capital market assumption for high-grade fixed income is a more conservative real return of 1% per year. Investors with typical spending requirements of 3-6% of assets per year cannot rely on traditional high grade fixed income to meet their spending needs if they seek to protect assets and income from inflation. Worse, as we have shown, bills and bonds have produced real decadal losses in extreme periods. Regular shortfalls and potential calamity in fixed investments is what leads us to our equity policies stated below in (4) and (5).
3) Secure long-term fixed income investments with a margin of safety and invest more aggressively at inflationary highs.
Investors have no choice but to take what is being offered in cash markets like T-Bills. They do have a choice when purchasing longer-dated bonds. A sensible policy for investing in fixed income with a margin of safety is to purchase long term bonds only when rates are near or above their long-term historical averages. Otherwise, maintain a shorter duration portfolio.
A higher fixed income allocation may be warranted at market extremes. While we believe equities are generally the best place to take duration risk given their role as inflation hedges, everything has a price. The highest annual decadal inflation rate from 1926-2022 was 8.7%. Therefore, investing in 10-year high-grade fixed income at rates of 7% or higher is likely to provide a sound fixed income margin of safety and possible real equity-like returns of 5-6% if inflation subsides to 2% or less. The early 1980s offered double-digit treasury rates, which turned out to be a historic opportunity to safely lock in an outstanding long-term real return. Yet equities were on sale then, too. The only bad investment at the time would have been T-Bills at double-digit yields, as short-term rates came down precipitously in the ensuing years.
4) Structure portfolios mostly in equities (or equity-like instruments) for return and to protect against inflation.
ACR generally advocates for a high equity allocation to produce long-term spendable returns in excess of inflation, and a much lower high-grade fixed income allocation for liquidity. The presence and level of the fixed income allocation is established based on the specific needs of investors with spending mandates. Our equity investment policy is partially based on historical outcomes. The expanded table below adds the real return for the S&P 500. Notice the lowest return for the S&P 500 is better than the lowest return for bills and bonds, but not by much. Importantly, the average annual real return shines compared to the real return on treasuries.
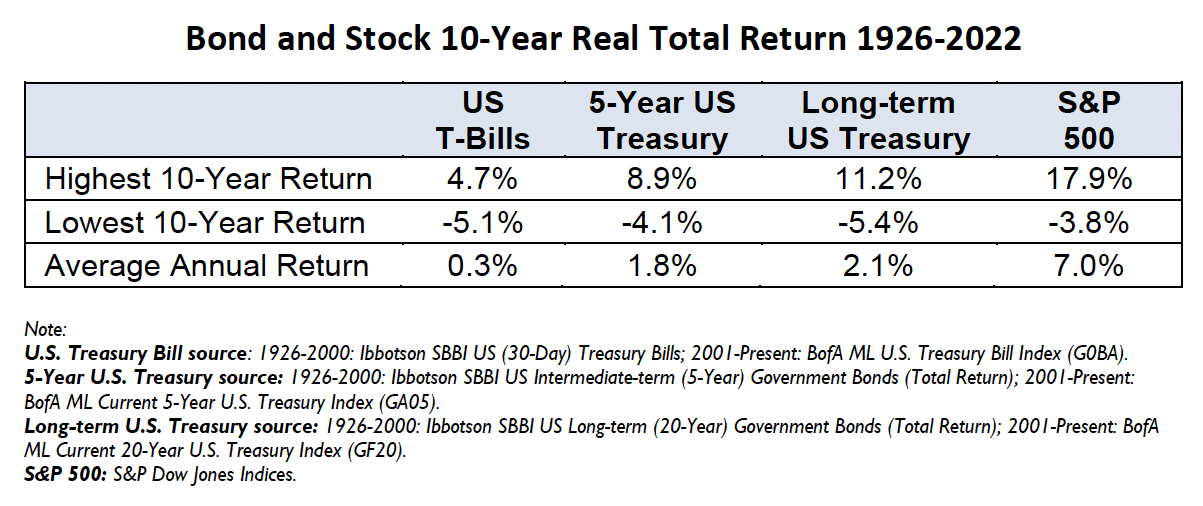
Major red flags, however, should be waving at this juncture. First, the lowest decadal return is still unacceptable, which we address in policy (5) below. Second, the average annual return is a poor guide, despite being over a nearly 100-year period. A 7% real return is double what we would expect in the coming decade based on general equity market yields today. We also address this problem in policy (5) below. Finally, a macroeconomic impairment must be considered.
Let us say nuclear catastrophe, a historic volcanic eruption, a pandemic with an extremely high infection fatality rate, a massive coronal mass ejection, or some such event occurs, and GDP resets at a permanently lower base. A large GDP reset would impair overall equity values, whereas high-grade fixed income claims may not be impaired. That is, if such a scenario doesn’t impair all capital. One can’t plan for Armageddon. In short, we believe inflation is far more likely to impair capital in the next 100 years than an event so calamitous that it makes the Great Depression and World Wars appear mild by comparison.
5) Exercise equity purchase price discipline and invest idiosyncratically as necessary.
Equities ought to be approached like fixed income. Both have yields which are indicative of their future return. And both have an element of imprecision. High-grade fixed income yields are uncertain largely due to inflation. Equity yields are uncertain largely due to earnings variability. Yet the yield is still an excellent guide to future returns. By our reckoning, the S&P 500 cyclically adjusted P/E is 33 based on as reported earnings, which translates to a paltry 3% earnings yield and expected real return. We avoid investing in equities with these characteristics, which is the reason our past returns are uniquely and positively different from the market.
When the overall equity market is not offering acceptable returns, the key to success is identifying equity investments, including higher yielding credit investments, with different and more attractive valuation characteristics. Critically, during periods like today, idiosyncratic portfolios, not general market portfolios, are essential for protecting from a contraction in valuation multiples and negative decadal real returns. ACR was willing to give up some return in the 2010s and in recent years, with the objective of protecting capital in the years ahead and capturing more return in the long term overall.
6) Hold and employ cash opportunistically with cash drag carefully quantified.
The policies discussed above require tremendous discipline. Sometimes this means holding T-Bills, patiently waiting until the right opportunities develop. ACR carefully assesses the cost of holding cash relative to our likely opportunity set. The telltale sign of success in this regard is a satisfactory past return that includes cash.
Nick Tompras | October 2023
End Notes:
1. For analysis dating to 1870 across economies see The Rate of Return on Everything, 1870–2015 Òscar Jordà, Katharina Knoll, Dmitry Kuvshinov, Moritz Schularick, and Alan M. Taylor.
2. For a primer on the new regime see The Fed’s New Monetary Policy Tools, Jane Ihrig, Ph.D., Board of Governors of the Federal Reserve System and Scott A. Wolla, Ph.D., Federal Reserve Bank of St. Louis, 2020.
3. Working paper forthcoming. Extended abstract at https://sites.wustl.edu/fazz/files/2020/06/FF-fisc-ext-abs.pdf.
IMPORTANT DISCLOSURES
ACR Alpine Capital Research LLC is an SEC registered investment adviser. For more information please refer to Form ADV on file with the SEC at www.adviserinfo.sec.gov. Registration with the SEC does not imply any particular level of skill or training.
All statistics highlighted in this research note are sourced from ACR’s analysis unless otherwise noted.
It should not be assumed that recommendations made in the future will be profitable or will equal the performance of the examples discussed. You should consider any strategy’s investment objectives, risks, and charges and expenses carefully before you invest.
This information should not be used as a general guide to investing or as a source of any specific investment recommendations, and makes no implied or expressed recommendations concerning the manner in which an account should or would be handled, as appropriate investment strategies depend upon specific investment guidelines and objectives. This is not an offer to sell or a solicitation to invest.
This information is intended solely to report on investment strategies implemented by Alpine Capital Research (“ACR”). Opinions and estimates offered constitute our judgment as of the date set forth above and are subject to change without notice, as are statements of financial market trends, which are based on current market conditions. There are risks associated with purchasing and selling securities and options thereon, including the risk that you could lose money. All material presented is compiled from sources believed to be reliable, but no guarantee is given as to its accuracy.
The investment outlook represents ACR’s views on the economic factors that may affect the global capital markets. There can be no guarantee that these factors will necessarily occur as ACR anticipates, nor that if they do, they will lead to positive performance returns. There can be no assurance that any objective will be achieved.
The Equity Quality Return (EQR) Total Accounts Composite consists of equity portfolios managed for non-wrap fee and wrap fee clients according to the Firm’s published investment policy. The composite investment policy includes the objective of providing satisfactory absolute and relative results in the long run, and to preserve capital from permanent loss during periods of economic decline. EQR invests only in publicly traded marketable common stocks. Total Return performance includes unrealized gains, realized gains, dividends, interest, and the re-investment of all income. Pure Gross returns are gross of all fees and do not reflect the deduction of transaction costs in wrap portfolios. Pure Gross returns are supplemental information. Net of ACR Fee returns are Pure Gross returns reduced by 1.0% per annum, which is the standard management fee for the Equity Quality Return strategy. Please refer to our full composite performance presentation with disclosures published under the Strategies section of our web site at www.acr-invest.com/strategies/eqr-advised-sma-composite.
The S&P 500 TR Index is a broad-based stock index including reinvestment of dividends and has been presented as an indication of domestic stock market performance. The S&P 500 TR index is unmanaged and cannot be purchased by investors. See EQR’s full composite presentation at www.acr-invest.com/strategies/eqr-advised-sma-composite.
A cynic once observed that normal is a place one passes going from one extreme to another. They must have just been studying the history of interest rates. ACR does not forecast interest rates because we do not think we can. The macroeconomic dynamics are too complex, confirmed by historical interest rate volatility. Forecasting interest rates, however, is different from anticipating the future of interest rates. In this quarter’s commentary, we survey interest rate history, discuss the key economic drivers of rates, and suggest policies for navigating future interest rate and inflation uncertainty.
Interest rates are an expansive topic because they are one of two foundational determinants of asset values, the other being investment cash flows. Therefore, this quarter’s commentary is more like a white paper. For the two-page version, read section I, skip section II, and read only the six one-sentence policy prescriptions listed in section III (beginning on page six).
I. A Brief History of Interest Rates
Over the past 50 years, the yield on the 10-year US treasury has ranged from over 15% in 1981 to less than 1% in 2020. The past two years have proven that interest rates are not a one-way ticket lower. After hitting bottom in 2020, the 10-year has risen to nearly 5%. Market participants in the early 1980s might have been forgiven for assuming just the opposite – that interest rates were a one-way ticket higher. The 10-year Treasury yield was around 2% in the mid-1950s before ascending to its historic peak. Below is a history of US treasury yields and inflation.
Given these extremes, is there an average which might be considered “normal?” The average monthly yield on the 10-year treasury since 1953 was 5.6%. With inflation running 3.5% over this period, the real yield (reduced by inflation) was approximately 2%. The problem with this historical average real yield, sometimes cited in forecasts, is it gives little indication of what one might earn over a sensible investment horizon. A step further back in history is necessary to fully appreciate the potential range of outcomes.
Our capital protection credo at ACR includes protecting from the “100-year economic flood”. This requires looking at the long history of economic calamities to see what lessons they may hold for us today. Date range inclusion for any series is as much art as science. Everything from political and economic regime to data quality must be considered. For US equity and debt, we believe data series going back to the 1920s are most useful for our purposes.1 Importantly, this period includes the Great Depression and WWII, quintessential US examples of 100-year economic floods. The table below is based on real US Treasury yields from 1926-2022.
The lowest 10-year return is for many investors shockingly bad, especially for those relying on a fixed income. Unfortunately, history offers a disconcerting illustration of the losses possible from investing in the highest quality bills and bonds in the world. Strategies for mitigating these outcomes are presented in section III.
II. Key Economic Drivers of Interest Rates
An examination of the key economic drivers of interest rates helps explain the historical volatility. Before proceeding, please note that our explanation is based in some parts on fact, and in others on opinion, which we always attempt to distinguish.
Interest rates in modern economies are largely established by central banks and expectations of real economic activity and inflation. In the US, the Federal Reserve (“the Fed”) establishes key rates, primarily the short-term Fed Funds Rate. While the specific tools have changed in recent years, with the
introduction of interest on Fed Funds and the purchase of long-term securities,2 the defining mechanism and goals of Fed monetary policy have been the same for some time. The Fed raises rates to cool economic activity and inflation, and it lowers rates to stimulate economic activity and employment.
The Fed had a very long runway of lowering rates beginning in the early 1980s. In our opinion, they began to think too much of their monetary powers. Witness how the Fed missed the extent of building economic fragility that culminated in the Great Financial Crisis (GFC). The response to the GFC was predictably to lower rates. Reducing rates is not necessarily the wrong response. The real issue, as we see it, is to understand at what rate level monetary policy becomes ineffective. We suspect somewhere in the low single digits. Regardless, it is difficult to go much below zero.
The Fed initiated a zero interest rate policy (ZIRP) during the GFC in 2008, which it maintained until 2016, and resumed again from 2020-2022. They also implemented quantitative easing (QE) beginning in 2008, the purchase of treasury and mortgage securities, initially to put a floor under collapsing asset prices, later to help reduce long-term rates for additional stimulus. Neither ZIRP nor QE, in our opinion, did much to stimulate growth, though others may disagree. Growth proved anemic coming out of the GFC, rather than the strong bounce one might expect from a significant downturn. We believe an even more convincing case for monetary policy impotency can be made in Europe and Japan. The European Central Bank (ECB) experimented with negative rates while the Japanese central bank dramatically expanded its balance sheet to include all manner of assets, including equities. Their reward? Continued anemic growth.
Nor did ZIRP and much-criticized central bank “money printing” lead to the massive inflation so many pundits and economists had predicted for so long. The imposition of zero rates and creation of excess reserves does not lead to economic growth or inflationary pressures if the funds never make it into the real economy via goods and services production and consumption. However, ZIRP did, in our opinion, stimulate inflation of another sort.
Asset prices rebounded after the GFC and kept rising in a historic bull market across all major asset classes. It is a mathematical axiom that fixed income asset prices move inversely with rates, and bond prices didn’t stop rising until the 2020 rate bottom. Low rates do not necessarily translate into higher equity prices (see Japan). Yet in the US, ZIRP seems to have caused TINA – “there is no alternative” to low rates other than equities and other riskier assets. We have quantified and spoken extensively about the rise in public equity market prices in relation to underlying corporate earnings in the back half of the 2010s. Debt leverage is a staple of real estate and private equity returns, so low rates naturally boosted asset prices in these markets. In section III we will address how to protect and profit from losses in markets which remain vulnerable to higher rates and potential further price declines.
Central bank and investor expectations of real economic activity and inflation are muddied by disagreement over key determinants. A discussion of these differences is beyond the scope of this commentary. Regardless of competing theories, however, most would agree that inflation will rise when demand exceeds all available supply. When the pandemic broke in early 2020, demand immediately collapsed, and unemployment skyrocketed. The US government responded with the greatest fiscal spending program since WWII. In our view, it is difficult to deny that this massive fiscal response, rather than central bank monetary policy, ultimately resulted in the prevention of a depression, robust economic growth, and eventually inflation.
Disagreement remains about how much pandemic-induced supply constraints or overzealous fiscal spending caused the recent spike in inflation, but either way Fed policy abruptly shifted to stamping out rising goods and services prices by raising short-term interest rates. In addition, the Fed initiated a policy of quantitative tightening (QT), the unwinding of QE. QT presently refers to letting treasury and mortgage securities mature rather than replacing them with new purchases. This reduces the size of the Fed’s balance sheet and supply of central bank reserves while putting upward pressure on rates. Yet by far the main driver of rising rates has been inflation expectations with high-grade corporate bonds now over 6%, 30-year mortgage securities touching 8%, and junk bonds over 9%.
The unpredictability inherent in economic activities and policies, and their interactions, confirms why rates and inflation have varied so widely. The future of interest rates is in our view uncertain because the determinants of rates are uncertain. Yet there are various guideposts that can help illuminate a path toward sound investment policies. For example, the Fed’s response to inflation in excess of 2% is relatively clear today, whereas we believe their response to disinflation is less clear. Fed policy is to raise rates to reduce inflation to 2%, at least once it determines inflation is a problem. Unfortunately, raising rates to reduce inflation is a blunt tool likely to cause recession unless wielded with precision – a very tall order. The jury is still out on that score today.
Ultimately, we believe monetary policy is capable of reducing inflation, and the Fed will orchestrate a higher real rate as a means to do so. We think of this as the spread theory of rates and inflation. As inflation rises so eventually will rates. For example, the rise in mortgage rates was preceded by an increase in housing prices and wages which in some part offset the rate increase. Production volume and the real rate of interest are what matter most, in a world where rising nominal rates broadly, but far from perfectly, keep pace with nominal price increases.
Fed policy appears less clear under disinflationary conditions. ZIRP is relatively new. Will the Fed return to ZIRP during the next recession? Or have they learned that ZIRP and long-term bond purchases may be better at distorting asset prices than stimulating demand? Our macroeconomic advisor, Professor Steve Fazzari, believes fiscal policy can be intelligently targeted to stimulate growth without necessarily causing a long-term increase in Debt/GDP.3 New ideas and solutions are needed when the economy is inordinately weak. We can only hope that the Fed will admit the limitations inherent in their monetary policy toolbelt when the time comes.
We conclude this section with a 4-point framework for describing key asset yield drivers and the potential future of interest rates. The underlying assumption is a reasonably well functioning free enterprise system. All bets are off under dysfunctional political and economic systems and failed regimes. This may bring to mind the US government today, with its inability, for example, to elect a house speaker last month. The US is far from perfect, but geopolitically and economically, we remain a bastion of strength. We are nowhere near the kind of state in which free enterprise economic dynamics fail to deliver innovation and prosperity. Let us count our lucky stars in this regard.
Key drivers of asset yields and the potential future of interest rates in today’s functioning free enterprise economies:
1) Real yields on government debt are largely what the central bank and government want them to be. Prolonged negative real returns on government debt largely occurred in the post-WWII years as the economy transitioned from war to peace time. Rates were not raised during this period to compensate for inflation. While this specific scenario is unlikely, negative real yields are possible under other circumstances and policies. For example, anemic growth and a Fed return to ZIRP at low inflation rates could result perennial negative real yields. While unlikely, we must consider the possibility. Overall, we expect a near zero real yield on short-term government debt based on central bank mandates for price stability but would be prepared for worse.
2) Real yields on long-term government debt are largely what the central bank and government want them to be, along with the premium investors require for term risk. Developed market central banks seem to be comfortable with QE/QT, so there is reason to believe central bank influence on long-term rates could be here to stay. Should the bias remain toward a permanently larger central bank balance sheet comprised of long-term securities, the term premium on long-term debt could remain somewhat repressed. Again, not a prediction, but possible. Overall, we would expect a real yield on long-term government debt of 1-2% based on central bank mandates for price stability but would be prepared for worse.
3) Real yields on corporate and other forms of non-government debt will contain a risk premium for credit risk in well-functioning capital markets. The question is if negative real yields on government debt persist someday, to what extent would they be transmitted into credit markets? In the recent past, while a credit spread remained, overall riskier debt yields declined with government debt yields as expected. Our working assumption, if real government debt yields remain slightly positive, is the continuation of a sensible credit spread and overall yield offering opportunity in individual securities. We would also expect credit yields and spreads that drift too low during more optimistic expansionary periods, and inordinately high yield spikes during panics, thus creating cyclical opportunities.
4) Real yields on equity will contain a risk premium for earnings variability in well-functioning capital markets. Investors and economists disagree about whether equities are a hedge against inflation. We believe equites are a hedge against inflation in the long-term and have discussed this topic extensively in past commentaries (see Inflation, Markets, and Returns). Equities are the only potential solution to policy-inflicted negative real bond yields. Equity prices, however, must be reasonable enough to compensate for the risk of overpaying for unpredictable and disappointing equity earnings.
III. Investment Strategy under Interest Rate and Inflation Uncertainty
Our policies for investing under interest rate and inflation uncertainty are simple and rooted in fundamental investment principles. Execution is the hard part. Most conventional asset allocation frameworks render implementation difficult at best. Requirements include unorthodox policies, extraordinary discipline, and opportunistic flexibility. These are our opinions, others may disagree.
1) Avoid long-term fixed income investments at rates well below historical averages.
We first warned of the perils of low long-term rates in our 2nd quarter 2013 commentary, The Low Rate, High Profit Value Mirage.
Interest rates are a different story. They may be at historic lows, but what happens when they rise? The recent small bounce in rates and attendant decline in bond and stock prices is a small harbinger of what is likely to happen when a more enduring increase takes hold. Note that bond prices should remain permanently lower given rising rates, but stock prices are likely to be buoyed by longer term economic growth and therefore should face more of a headwind than a permanent decline.
While we may know the outcome of rising rates, we have no idea of the timing, whether tomorrow or in twenty years. Still, we want to protect our client capital. Protection from rising rates requires avoidance of companies with excessive short-term debt or financial institutions that borrow short and lend long. Financial firms that hold long-term loans at historically low rates and borrow at short-term rates are vulnerable. In the EQR portfolio, our industrial companies have limited debt, and our financials should generally benefit from rising rates due to their diverse business lines and asset/liability mix.
While it took 10 years for rates to finally rise, investors who avoided long-term bonds in 2013 didn’t miss much. The 10-year yield started 2013 at 1.7% and ended the year at 3.0%. While better than 0% T-Bills, equity markets were offering better long-term returns.
Unfortunately, many regional banks did make “long-term loans at historically low rates and borrow[ed] at short-term rates,” which precipitated the regional banking crisis earlier this year. The story here may not be finished. The longer that short-term rates stay high, the more likely banks, real estate investors, and private equity sponsors who invested long-term and borrowed short-term at inadequate spreads will come into trouble. Imprudence of this sort is likely to provide opportunities for our credit team.
The debt-related risk embedded in our equity portfolio companies remains relatively low, much as it was ten years ago. Our portfolio companies continue to maintain on average higher
investment grade debt levels and term structures, and our financials continue to be very well positioned for rising yields. ACR’s property & casualty insurance companies are almost entirely void of long-term bonds, and our money center banks are insulated from the duration risks posed by many regional banks due to their “diverse business lines and asset/liability mix”.
2) Employ high-grade fixed income investments for liquidity.
Investors with regular fixed spending needs that exceed dividends and interest require sufficient liquidity when equity portfolio sales are not advisable. Investors cannot of course expect to realize equity gains every year. Worse, gains may run dry for several years during secular bear markets. High-grade fixed income with a proper term structure is an essential source of liquidity to assure spending needs are met when equity prices are depressed.
Now that rates are higher, investors are likely to think of fixed investments as a source of income again. While the additional interest is a welcome bonus post ZIRP, a mistake many fixed income investors make is to think in nominal rather than real terms. Investors wishing to preserve value relative to inflation must think in real terms. Unlike equity yields, which are in effect real when companies are able to raise prices with costs, fixed income investors must reduce their expected nominal yield by inflation to compare equity and fixed yields on an apples-to-apples basis. Inflation adjustment significantly reduces the real spendable income from fixed income.
Optimistically, we believe the real return on high grade fixed income could average 2% per year. However, our capital market assumption for high-grade fixed income is a more conservative real return of 1% per year. Investors with typical spending requirements of 3-6% of assets per year cannot rely on traditional high grade fixed income to meet their spending needs if they seek to protect assets and income from inflation. Worse, as we have shown, bills and bonds have produced real decadal losses in extreme periods. Regular shortfalls and potential calamity in fixed investments is what leads us to our equity policies stated below in (4) and (5).
3) Secure long-term fixed income investments with a margin of safety and invest more aggressively at inflationary highs.
Investors have no choice but to take what is being offered in cash markets like T-Bills. They do have a choice when purchasing longer-dated bonds. A sensible policy for investing in fixed income with a margin of safety is to purchase long term bonds only when rates are near or above their long-term historical averages. Otherwise, maintain a shorter duration portfolio.
A higher fixed income allocation may be warranted at market extremes. While we believe equities are generally the best place to take duration risk given their role as inflation hedges, everything has a price. The highest annual decadal inflation rate from 1926-2022 was 8.7%. Therefore, investing in 10-year high-grade fixed income at rates of 7% or higher is likely to provide a sound fixed income margin of safety and possible real equity-like returns of 5-6% if inflation subsides to 2% or less. The early 1980s offered double-digit treasury rates, which turned out to be a historic opportunity to safely lock in an outstanding long-term real return. Yet equities were on sale then, too. The only bad investment at the time would have been T-Bills at double-digit yields, as short-term rates came down precipitously in the ensuing years.
4) Structure portfolios mostly in equities (or equity-like instruments) for return and to protect against inflation.
ACR generally advocates for a high equity allocation to produce long-term spendable returns in excess of inflation, and a much lower high-grade fixed income allocation for liquidity. The presence and level of the fixed income allocation is established based on the specific needs of investors with spending mandates. Our equity investment policy is partially based on historical outcomes. The expanded table below adds the real return for the S&P 500. Notice the lowest return for the S&P 500 is better than the lowest return for bills and bonds, but not by much. Importantly, the average annual real return shines compared to the real return on treasuries.
Major red flags, however, should be waving at this juncture. First, the lowest decadal return is still unacceptable, which we address in policy (5) below. Second, the average annual return is a poor guide, despite being over a nearly 100-year period. A 7% real return is double what we would expect in the coming decade based on general equity market yields today. We also address this problem in policy (5) below. Finally, a macroeconomic impairment must be considered.
Let us say nuclear catastrophe, a historic volcanic eruption, a pandemic with an extremely high infection fatality rate, a massive coronal mass ejection, or some such event occurs, and GDP resets at a permanently lower base. A large GDP reset would impair overall equity values, whereas high-grade fixed income claims may not be impaired. That is, if such a scenario doesn’t impair all capital. One can’t plan for Armageddon. In short, we believe inflation is far more likely to impair capital in the next 100 years than an event so calamitous that it makes the Great Depression and World Wars appear mild by comparison.
5) Exercise equity purchase price discipline and invest idiosyncratically as necessary.
Equities ought to be approached like fixed income. Both have yields which are indicative of their future return. And both have an element of imprecision. High-grade fixed income yields are uncertain largely due to inflation. Equity yields are uncertain largely due to earnings variability. Yet the yield is still an excellent guide to future returns. By our reckoning, the S&P 500 cyclically adjusted P/E is 33 based on as reported earnings, which translates to a paltry 3% earnings yield and expected real return. We avoid investing in equities with these characteristics, which is the reason our past returns are uniquely and positively different from the market.
When the overall equity market is not offering acceptable returns, the key to success is identifying equity investments, including higher yielding credit investments, with different and more attractive valuation characteristics. Critically, during periods like today, idiosyncratic portfolios, not general market portfolios, are essential for protecting from a contraction in valuation multiples and negative decadal real returns. ACR was willing to give up some return in the 2010s and in recent years, with the objective of protecting capital in the years ahead and capturing more return in the long term overall.
6) Hold and employ cash opportunistically with cash drag carefully quantified.
The policies discussed above require tremendous discipline. Sometimes this means holding T-Bills, patiently waiting until the right opportunities develop. ACR carefully assesses the cost of holding cash relative to our likely opportunity set. The telltale sign of success in this regard is a satisfactory past return that includes cash.
Nick Tompras | October 2023
End Notes:
1. For analysis dating to 1870 across economies see The Rate of Return on Everything, 1870–2015 Òscar Jordà, Katharina Knoll, Dmitry Kuvshinov, Moritz Schularick, and Alan M. Taylor.
2. For a primer on the new regime see The Fed’s New Monetary Policy Tools, Jane Ihrig, Ph.D., Board of Governors of the Federal Reserve System and Scott A. Wolla, Ph.D., Federal Reserve Bank of St. Louis, 2020.
3. Working paper forthcoming. Extended abstract at https://sites.wustl.edu/fazz/files/2020/06/FF-fisc-ext-abs.pdf.
IMPORTANT DISCLOSURES
ACR Alpine Capital Research LLC is an SEC registered investment adviser. For more information please refer to Form ADV on file with the SEC at www.adviserinfo.sec.gov. Registration with the SEC does not imply any particular level of skill or training.
All statistics highlighted in this research note are sourced from ACR’s analysis unless otherwise noted.
It should not be assumed that recommendations made in the future will be profitable or will equal the performance of the examples discussed. You should consider any strategy’s investment objectives, risks, and charges and expenses carefully before you invest.
This information should not be used as a general guide to investing or as a source of any specific investment recommendations, and makes no implied or expressed recommendations concerning the manner in which an account should or would be handled, as appropriate investment strategies depend upon specific investment guidelines and objectives. This is not an offer to sell or a solicitation to invest.
This information is intended solely to report on investment strategies implemented by Alpine Capital Research (“ACR”). Opinions and estimates offered constitute our judgment as of the date set forth above and are subject to change without notice, as are statements of financial market trends, which are based on current market conditions. There are risks associated with purchasing and selling securities and options thereon, including the risk that you could lose money. All material presented is compiled from sources believed to be reliable, but no guarantee is given as to its accuracy.
The investment outlook represents ACR’s views on the economic factors that may affect the global capital markets. There can be no guarantee that these factors will necessarily occur as ACR anticipates, nor that if they do, they will lead to positive performance returns. There can be no assurance that any objective will be achieved.
The Equity Quality Return (EQR) Total Accounts Composite consists of equity portfolios managed for non-wrap fee and wrap fee clients according to the Firm’s published investment policy. The composite investment policy includes the objective of providing satisfactory absolute and relative results in the long run, and to preserve capital from permanent loss during periods of economic decline. EQR invests only in publicly traded marketable common stocks. Total Return performance includes unrealized gains, realized gains, dividends, interest, and the re-investment of all income. Pure Gross returns are gross of all fees and do not reflect the deduction of transaction costs in wrap portfolios. Pure Gross returns are supplemental information. Net of ACR Fee returns are Pure Gross returns reduced by 1.0% per annum, which is the standard management fee for the Equity Quality Return strategy. Please refer to our full composite performance presentation with disclosures published under the Strategies section of our web site at www.acr-invest.com/strategies/eqr-advised-sma-composite.
The S&P 500 TR Index is a broad-based stock index including reinvestment of dividends and has been presented as an indication of domestic stock market performance. The S&P 500 TR index is unmanaged and cannot be purchased by investors. See EQR’s full composite presentation at www.acr-invest.com/strategies/eqr-advised-sma-composite.
More Posts
Finding Self-Worth in Retirement
Trump Tariffs, Business Chaos, and Valuation Adjustment – Q1 2025
Estate Planning: Beyond the Will
Mr. Market, Riding High – Q4 2024