The Banking Crisis of 2023 fizzled in the 2nd quarter, prompting a relief rally in stock and credit markets. Our perspective on market movements as a value investor tends to be the opposite of most investors. If we have any amount of cash (and we usually do), we prefer lower prices to higher. While the typical investor may feel better after prices rise, we oftentimes feel a twinge of anxiety. After all, our goal is to lock in the lowest prices relative to value at all times. Market volatility is our friend in this regard.
In our flagship EQR strategy, the first half of the year required us to trim four holdings. We say “required” because a quantitative discipline determines these decisions. The size of a position in our portfolios is a function of three variables: (1) how much we know about a company, (2) the quality of the company, and (3) the company’s stock price relative to its value. The more we know, the higher the quality, and the lower the price, the more we are willing to allocate to a holding. Diversification plays a critical role in establishing position sizes, and thereby controlling risk, in conjunction with these variables.
Proper diversification is achieved when the overall portfolio return is protected from adverse results in individual holdings, industries, countries, or other risk factors. No matter how favorable a company appears along the three variables of knowledge, quality, and value, we will never invest too much in any one company, or in any group of companies which are subject to similar risk factors. We are often asked, when holding cash, why not allocate more to each holding? The answer is that we have a hard stop on every company’s position size to control risk. When holding excess cash, we are always at our maximum position size based upon the risk we are willing to take in each holding.
The four holdings we trimmed were coming close to full value due to price appreciation. Their position sizes had each grown to 7-10% of the overall portfolio. As price approaches a company’s fundamental value, a stock becomes riskier, all else equal. We were willing to originally own these companies at somewhat lower position sizes. At their appreciated prices, they had begun to breach our limits of diversification and risk. Of course, company value oftentimes increases with market price. Our regular adjustments to value account for this dynamic. Only when price rises faster than value does price/value and risk also rise.
The value investor’s unique perspective on market price fluctuations also applies to investment value. We think the average investor’s almost obsessive focus with the daily change in value of their brokerage account, is a flawed way to understand the true return-generating ability of their portfolio. The return potential of a portfolio is better defined by the spendable income and future value it will provide. The current brokerage account value tells the investor one thing: what they can sell their entire portfolio for today. Unless one wants to sell everything today, this figure has limited use.
More germane to the average investor is what they are likely to spend or give away over time. For individuals and institutions alike, most spending typically occurs in increments of say 3-6% of portfolio value per year. Rarely does anyone liquidate their entire net worth at one moment in time. So, the spending side generally occurs incrementally. What about the value creation side? The value creation side also occurs incrementally each year via company income. If both spending and value creation occur incrementally each year, then why do so many investors obsess on current portfolio value? The answer is because it is readily available. Yet that doesn’t make it particularly useful.
ACR focuses on company income (cash earning power), which in turn produces spendable cash income for our investors via dividends and capital gains – a very different perspective. This leads us to the last difference in perspective between value investors and the typical investor: time. Since value is generated incrementally over time, we are not thinking about days, months, quarters, or even a year. In our view, a decade is an appropriate increment as this is enough time for a significant amount of corporate income to convert into dividends, realized gains, and sustainable unrealized gains.
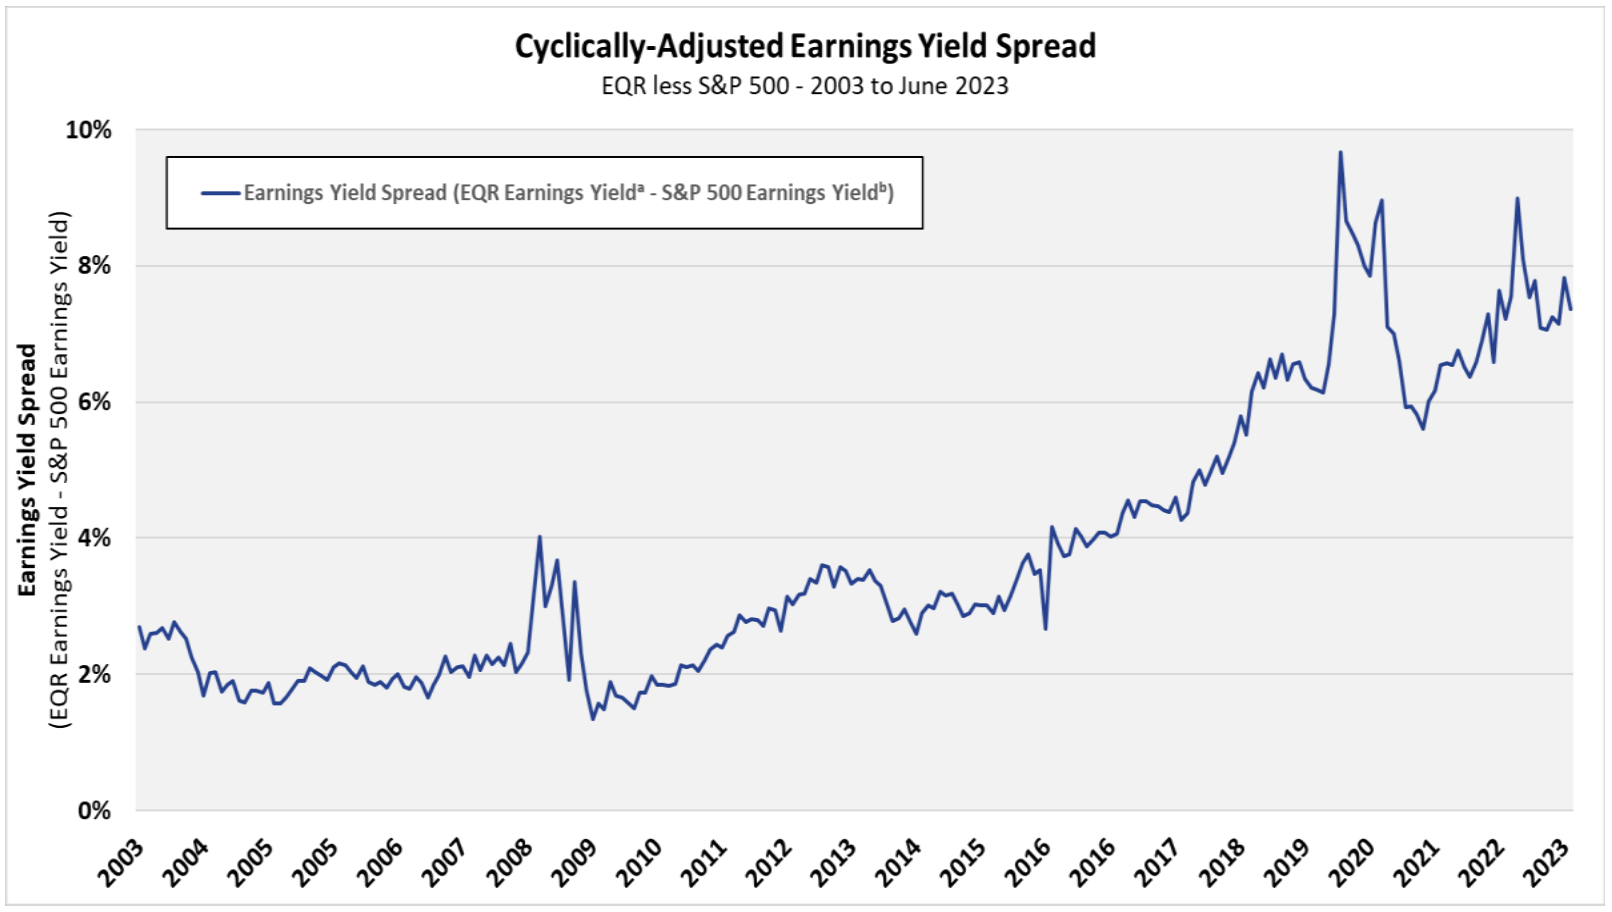
Of course, we have to keep score in the meantime, which is why we provide conventional “total return” data, preferably digested in increments of at least one year-at-a-time. More importantly, we provide a number of statistics related to company income. On that note, the first chart shows the cyclically adjusted earnings yield for EQR and the S&P 500. The second chart shows the difference or “spread” between the two.
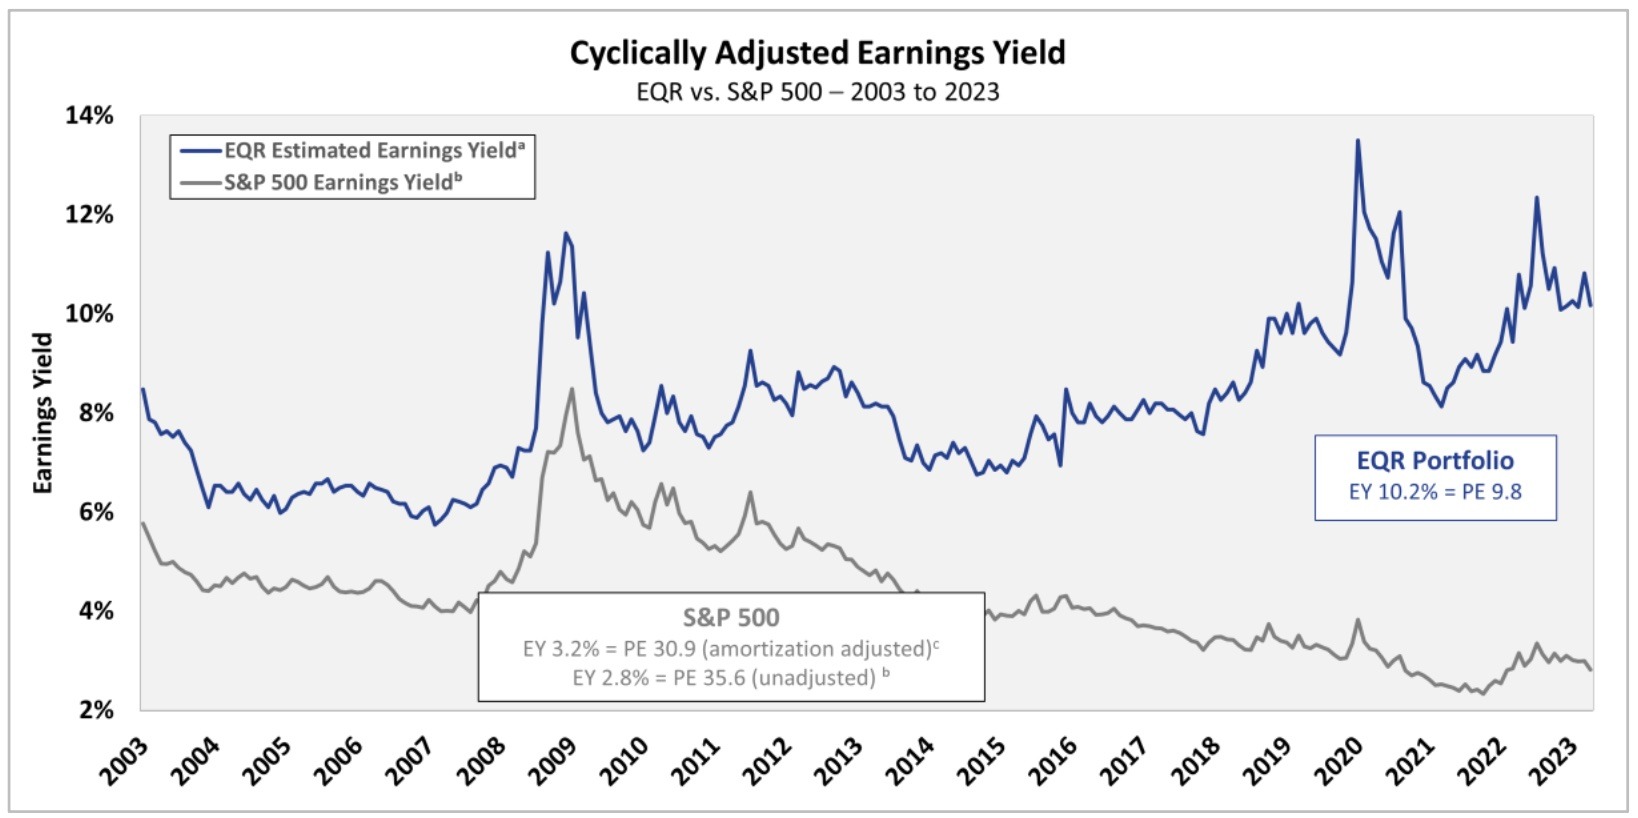
The cyclically adjusted earnings yield (it is an estimate), in theory, represents the cash dividend yield that a company or portfolio could pay each year while maintaining its current unit production and growing at the rate of inflation (assuming constant inflation and the ability to raise prices with costs). EQR’s quarter-end earnings yield was a robust 10.2% while the S&P 500 was 2.8%. Below are several observations from these charts:
- The EQR earnings yield has been rising since the middle of the last decade as EQR earnings relative to prices have risen. This is partially due to earnings growth and largely due to regularly pruning our portfolio when price rises too high relative to earnings and value.
- The S&P 500 earnings yield has been falling since the middle of the last decade. This is largely due to stock prices rising faster than company earnings.
- The spread between EQR and the S&P 500 grew to historically wide proportions in the late teens, completely blew out during the fiscal/monetary stimulus infused pandemic, and ended up still higher than where it was in 2019.
- The wide spread continues to bode well for EQR on an absolute and relative basis (compared to the S&P 500).
Relief rallies can just as quickly be followed by routs of fear. We do not believe anyone has a crystal ball, or at least we don’t. We do think that higher rates and tighter credit will slow the economy, and if the economy doesn’t slow enough, the Fed seems committed to making sure it does. Corporate profits as measured by the S&P 500 peaked in the first quarter of 2022 and are currently down 10% (as of 2Q- 2023 given estimates and 20% of companies reporting). Our credit team is seeing distress in certain pockets such as commercial real estate, leveraged loans, and regional banks. The ACR investment team continues to plan for (not predict) recession, which is reflected in the current earning power of our holdings.
Nick Tompras
July 2023
The Banking Crisis of 2023 fizzled in the 2nd quarter, prompting a relief rally in stock and credit markets. Our perspective on market movements as a value investor tends to be the opposite of most investors. If we have any amount of cash (and we usually do), we prefer lower prices to higher. While the typical investor may feel better after prices rise, we oftentimes feel a twinge of anxiety. After all, our goal is to lock in the lowest prices relative to value at all times. Market volatility is our friend in this regard.
In our flagship EQR strategy, the first half of the year required us to trim four holdings. We say “required” because a quantitative discipline determines these decisions. The size of a position in our portfolios is a function of three variables: (1) how much we know about a company, (2) the quality of the company, and (3) the company’s stock price relative to its value. The more we know, the higher the quality, and the lower the price, the more we are willing to allocate to a holding. Diversification plays a critical role in establishing position sizes, and thereby controlling risk, in conjunction with these variables.
Proper diversification is achieved when the overall portfolio return is protected from adverse results in individual holdings, industries, countries, or other risk factors. No matter how favorable a company appears along the three variables of knowledge, quality, and value, we will never invest too much in any one company, or in any group of companies which are subject to similar risk factors. We are often asked, when holding cash, why not allocate more to each holding? The answer is that we have a hard stop on every company’s position size to control risk. When holding excess cash, we are always at our maximum position size based upon the risk we are willing to take in each holding.
The four holdings we trimmed were coming close to full value due to price appreciation. Their position sizes had each grown to 7-10% of the overall portfolio. As price approaches a company’s fundamental value, a stock becomes riskier, all else equal. We were willing to originally own these companies at somewhat lower position sizes. At their appreciated prices, they had begun to breach our limits of diversification and risk. Of course, company value oftentimes increases with market price. Our regular adjustments to value account for this dynamic. Only when price rises faster than value does price/value and risk also rise.
The value investor’s unique perspective on market price fluctuations also applies to investment value. We think the average investor’s almost obsessive focus with the daily change in value of their brokerage account, is a flawed way to understand the true return-generating ability of their portfolio. The return potential of a portfolio is better defined by the spendable income and future value it will provide. The current brokerage account value tells the investor one thing: what they can sell their entire portfolio for today. Unless one wants to sell everything today, this figure has limited use.
More germane to the average investor is what they are likely to spend or give away over time. For individuals and institutions alike, most spending typically occurs in increments of say 3-6% of portfolio value per year. Rarely does anyone liquidate their entire net worth at one moment in time. So, the spending side generally occurs incrementally. What about the value creation side? The value creation side also occurs incrementally each year via company income. If both spending and value creation occur incrementally each year, then why do so many investors obsess on current portfolio value? The answer is because it is readily available. Yet that doesn’t make it particularly useful.
ACR focuses on company income (cash earning power), which in turn produces spendable cash income for our investors via dividends and capital gains – a very different perspective. This leads us to the last difference in perspective between value investors and the typical investor: time. Since value is generated incrementally over time, we are not thinking about days, months, quarters, or even a year. In our view, a decade is an appropriate increment as this is enough time for a significant amount of corporate income to convert into dividends, realized gains, and sustainable unrealized gains.
Of course, we have to keep score in the meantime, which is why we provide conventional “total return” data, preferably digested in increments of at least one year-at-a-time. More importantly, we provide a number of statistics related to company income. On that note, the first chart shows the cyclically adjusted earnings yield for EQR and the S&P 500. The second chart shows the difference or “spread” between the two.
Price as of June 30, 2023; EPS as of June 30, 2023. Sources: S&P Dow Jones Indices; Robert Shiller; BLS CPI Data; ACR Alpine Capital Research. S&P 500 EPS sourced from Shiller data through March 31, 2023. Most Recent S&P 500 TTM EPS estimate as of June 30, 2023, sourced from Howard Silverblatt.
Earnings Yield (“EY”) is the inverse of the Price-to-Earnings Ratio (i.e. EPS/Price). EY Represents estimated earnings that could be paid out in dividends as a percentage of current price. Yields (income/price) are the most fundamental metric to compare the margin of safety for an investment (e.g Earnings Yield for Equities, Yield to Maturity for Bonds.)
Price as of June 30, 2023; EPS as of June 30, 2023. Sources: S&P Dow Jones Indices; Robert Shiller; BLS CPI Data; ACR Alpine Capital Research. EPS data has been S&P 500 EPS sourced from Shiller data through March 31, 2023. Most Recent S&P 500 TTM EPS estimate as of June 30, 2023, sourced from Howard Silverblatt.
The cyclically adjusted earnings yield (it is an estimate), in theory, represents the cash dividend yield that a company or portfolio could pay each year while maintaining its current unit production and growing at the rate of inflation (assuming constant inflation and the ability to raise prices with costs). EQR’s quarter-end earnings yield was a robust 10.2% while the S&P 500 was 2.8%. Below are several observations from these charts:
Relief rallies can just as quickly be followed by routs of fear. We do not believe anyone has a crystal ball, or at least we don’t. We do think that higher rates and tighter credit will slow the economy, and if the economy doesn’t slow enough, the Fed seems committed to making sure it does. Corporate profits as measured by the S&P 500 peaked in the first quarter of 2022 and are currently down 10% (as of 2Q- 2023 given estimates and 20% of companies reporting). Our credit team is seeing distress in certain pockets such as commercial real estate, leveraged loans, and regional banks. The ACR investment team continues to plan for (not predict) recession, which is reflected in the current earning power of our holdings.
Nick Tompras
July 2023
ACR Alpine Capital Research LLC is an SEC registered investment adviser. For more information please refer to Form ADV on file with the SEC at www.adviserinfo.sec.gov. Registration with the SEC does not imply any particular level of skill or training.
All statistics highlighted in this research note are sourced from ACR’s analysis unless otherwise noted.
It should not be assumed that recommendations made in the future will be profitable or will equal the performance of the examples discussed. You should consider any strategy’s investment objectives, risks, and charges and expenses carefully before you invest.
This information should not be used as a general guide to investing or as a source of any specific investment recommendations, and makes no implied or expressed recommendations concerning the manner in which an account should or would be handled, as appropriate investment strategies depend upon specific investment guidelines and objectives. This is not an offer to sell or a solicitation to invest.
This information is intended solely to report on investment strategies implemented by Alpine Capital Research (“ACR”). Opinions and estimates offered constitute our judgment as of the date set forth above and are subject to change without notice, as are statements of financial market trends, which are based on current market conditions. There are risks associated with purchasing and selling securities and options thereon, including the risk that you could lose money. All material presented is compiled from sources believed to be reliable, but no guarantee is given as to its accuracy.
The investment outlook represents ACR’s views on the economic factors that may affect the global capital markets. There can be no guarantee that these factors will necessarily occur as ACR anticipates, nor that if they do, they will lead to positive performance returns. There can be no assurance that any objective will be achieved.
The Equity Quality Return (EQR) Total Accounts Composite consists of equity portfolios managed for non-wrap fee and wrap fee clients according to the Firm’s published investment policy. The composite investment policy includes the objective of providing satisfactory absolute and relative results in the long run, and to preserve capital from permanent loss during periods of economic decline. EQR invests only in publicly traded marketable common stocks. Total Return performance includes unrealized gains, realized gains, dividends, interest, and the re-investment of all income. Pure Gross returns are gross of all fees and do not reflect the deduction of transaction costs in wrap portfolios. Pure Gross returns are supplemental information. Net of ACR Fee returns are Pure Gross returns reduced by 1.0% per annum, which is the standard management fee for the Equity Quality Return strategy. Please refer to our full composite performance presentation with disclosures published under the Strategies section of our web site at www.acr-invest.com/strategies/eqr-advised-sma-composite.
The S&P 500 TR Index is a broad-based stock index including reinvestment of dividends and has been presented as an indication of domestic stock market performance. The S&P 500 TR index is unmanaged and cannot be purchased by investors. See EQR’s full composite presentation at www.acr-invest.com/strategies/eqr-advised-sma-composite.
More Posts
Finding Self-Worth in Retirement
Trump Tariffs, Business Chaos, and Valuation Adjustment – Q1 2025
Estate Planning: Beyond the Will
Mr. Market, Riding High – Q4 2024