2023 marked a year of outsized stock price gains for the most popular US companies. Regardless of the moniker – The Magnificent Seven, FANGS, or Nifty-Fifty – the well-worn pattern is as old as stock investing. There are always leading companies. The very first was the Dutch East India Company, which was formed in 1602. Typically, leading companies share three characteristics: they have grown for years, are significant and disruptive innovators, and inevitably become popular among investors. Judging whether a company has become too popular is not always easy. What is clear is that the US equity market marched higher last year on the back of the Magnificent Seven. The main message of our 2023 commentary is that ownership of leading companies is not necessary for investment success, and the results from investing in them can be disappointing at the wrong price.
The market value of our equity strategies rose significantly faster last year than our companies’ underlying earnings and fundamental values. We believe the prices of our companies rose from very attractive lows while their fundamental values progressed at a steady pace. The estimated fundamental return of our flagship Equity Quality Return (“EQR”) strategy was 9.7% last year, while the price/value of the portfolio rose from 0.71 to 0.811. This compares to a price/value historical average of 0.84 since 2003. ACR’s investment results can be found at www.acr-invest.com/strategies.
Context and Conditions
The decade of the 2020s has been eventful so far, to say the least: pandemic, recession, inflation, political unrest, rising rates, two bear markets, two wars, and two bull markets. Yet, while so much happened, it seems like 2019 was yesterday. Statistically, the US equity market has been in a valuation time warp, ending roughly where it began. The following observation appears apropos circa 2019 and 2023: general equity market prices are historically high, and a small group of companies remain comparatively cheap. While there are no guarantees, the consequences are likely two-fold: EQR earns returns consistent with past results, whereas equity markets earn mid-single-digit returns with the risk of a lost decade.
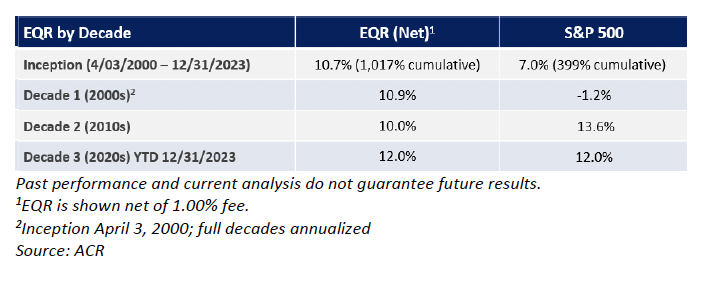
We are not, however, sitting around waiting for markets to adjust. Instead, we own companies that are converting corporate profits into dividends and realized gains now. This decade, the total annualized return for EQR and the S&P 500 was coincidentally 12.0% per year2. Our estimates also show that the S&P 500 cyclically adjusted P/E rose from 32.7 to 37.0 over these four years, whereas EQR’s cyclically adjusted P/E declined from 10.9 to 10.43. In other words, the S&P 500’s 12% return was likely earned with rising valuation risk, while our analysis shows that EQR’s 12% net return was not. This is not a new story, of course. Our update of two familiar charts will help to illustrate the point.
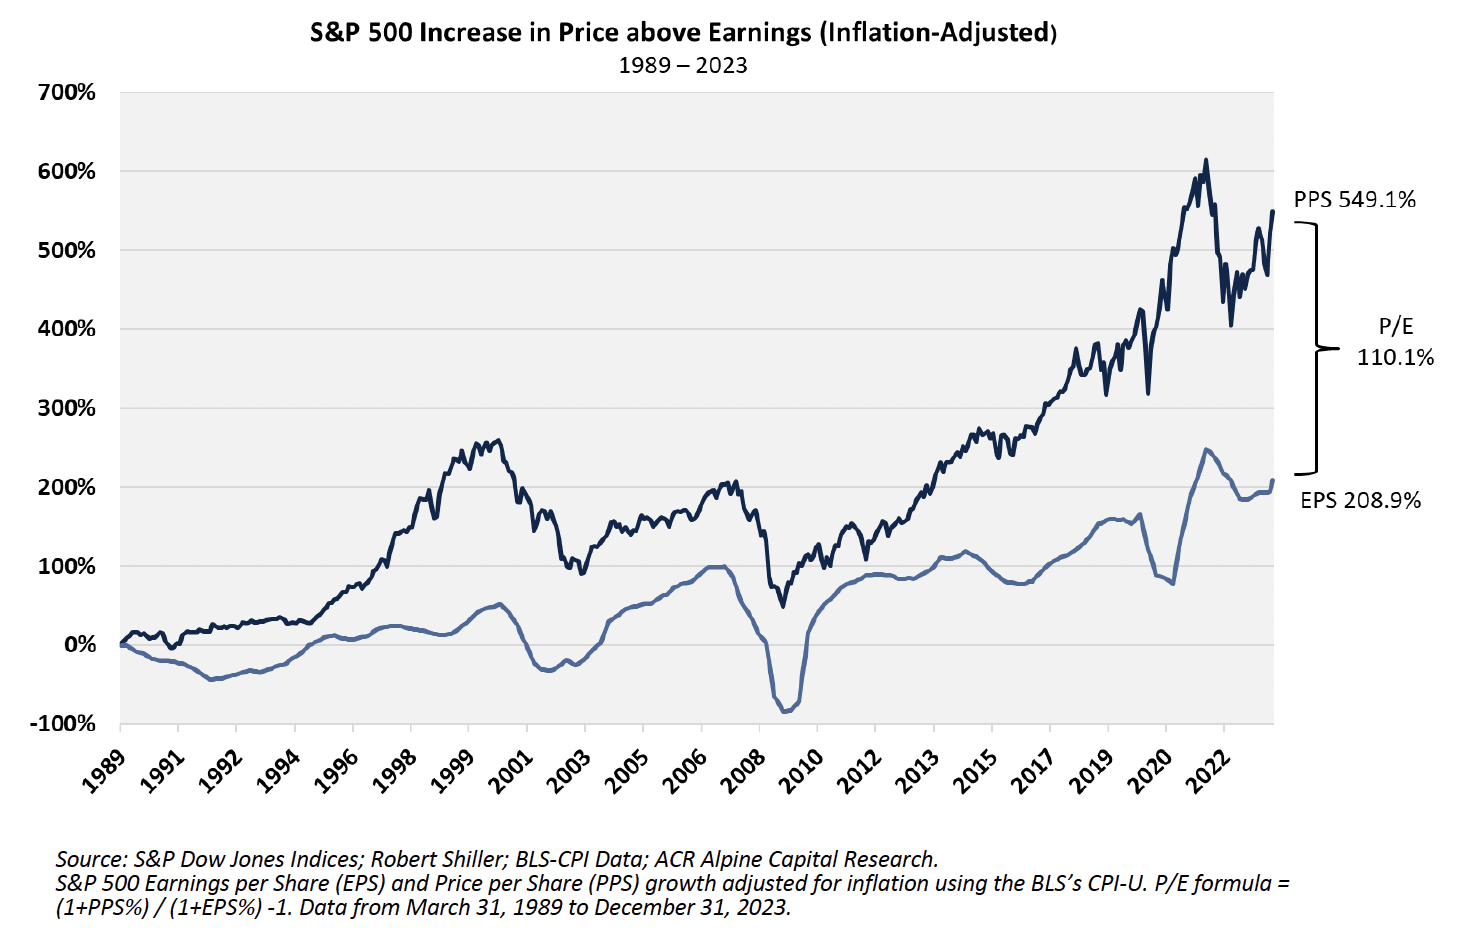
Prices have been rising faster than earnings for decades. The chart above shows the phenomenon back to 1989. This period has particular significance for ACR’s founder, who started in the investment business full-time in 1990. The folly of dividing investment returns into months, quarters, or even a few years is that an entire investment career may only encompass three or four discrete periods. The past three decades in US equities can be characterized by three markets: the 1990s Internet bubble, the 2000s valuation and GFC4 retrenchments, and the 2010s liquidity recovery bubble. We are not really sure what to call the 2010s and 20s yet. Our label acknowledges the period’s unprecedented Fed balance sheet expansion, which could be a key driver of higher financial asset prices beyond just plain buying without awareness of fundamental value or return. The eventful 2020s have surprisingly extended the bubbly prices of the 2010s to today.
While the goods and services economy and financial markets are connected economically, the dynamics don’t always align. For example, the equity market rise during the housing bubble, culminating in the GFC, was overshadowed in the 2000s by the valuation and GFC bear markets. Another recent example is that valuation multiples have contracted somewhat in interest rate-sensitive asset classes such as private equity and real estate (when clearing), even as they remain buoyant in public equity markets as measured by indexes like the S&P 500.
Again, ACR is not waiting for an equity market adjustment or retrenchment. EQR results have been consistent through both bubbles and retrenchments5. One critical reason is our penchant for risk control. The ACR investment team is keen to understand systemic, industry, and company fragilities and imbalances. For example, our analysis of broader economic and market characteristics helped us avoid tech stocks in the early 2000s and financials in the mid-2000s. That said, while seeking to understand systemic economic issues, our buy-and-sell decisions are never made based on “top-down” forecasts of macroeconomic variables such as employment, inflation, or interest rates. Instead, our bottom-up valuations are informed by corporate performance estimates adjusted for an appropriately wide range of relevant economic outcomes. In recent years, which echo the late 1990s, the most significant systemic economic risk appears to be high-tech-driven valuations rather than underlying economic or financial system fragility. Yet, there is enough entity level over-indebtedness, some of it tied to insufficient asset yields, that a more pedestrian recession could spiral into a harder landing, producing a good deal of economic pain, and opportunity.
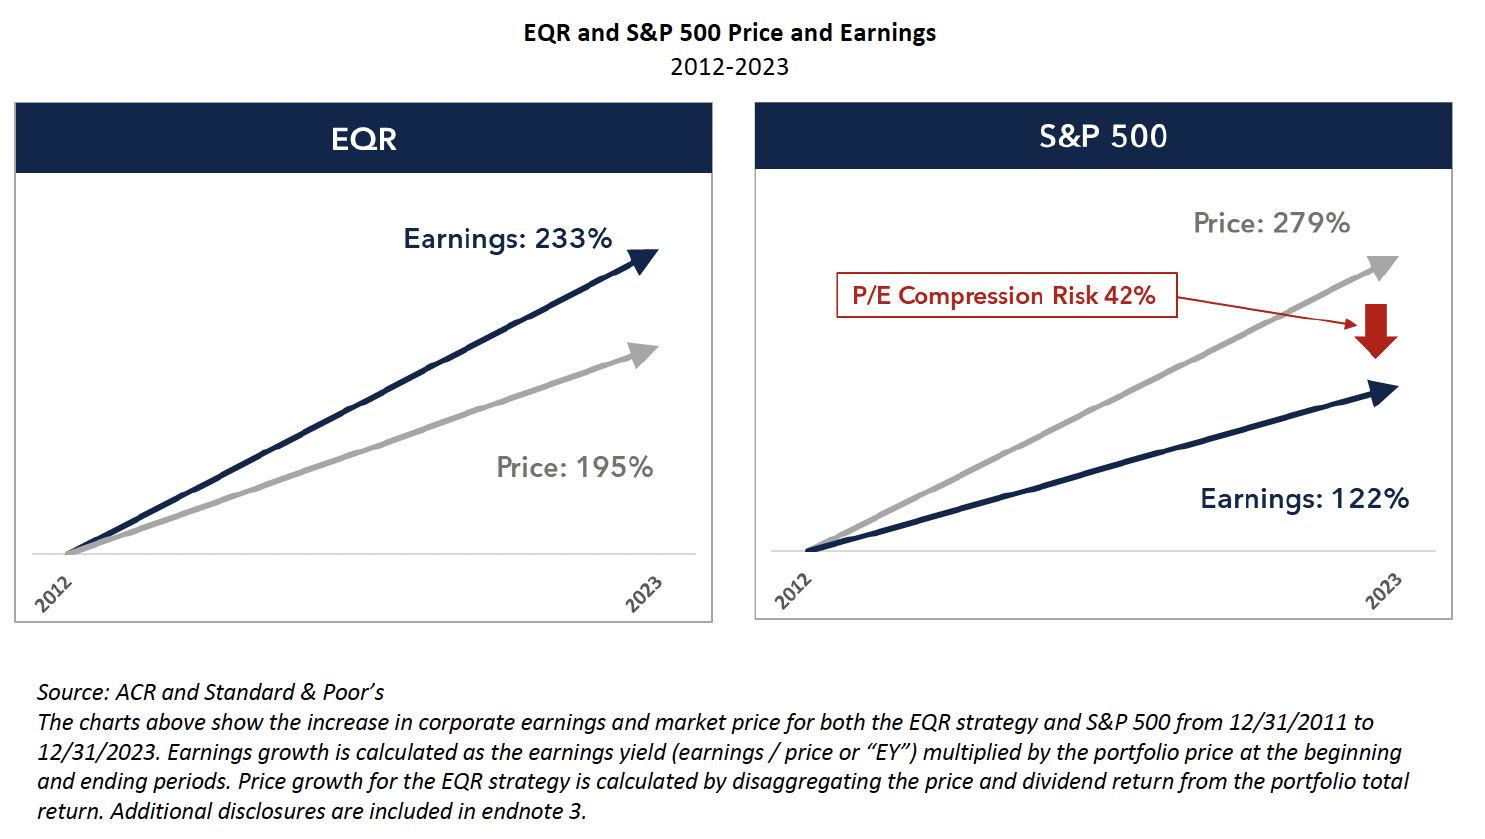
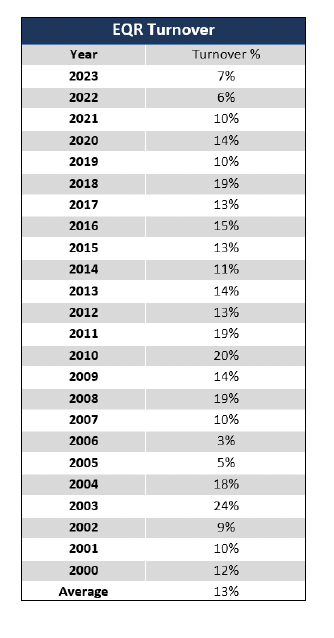
The chart above shows price and earnings development for EQR and the S&P 500 from 2012 to 20236. Note that earnings development includes both the earnings growth generated by our portfolio companies and the value captured by replacing higher-priced with lower-priced holdings. While we don’t do a lot of buying and selling, as shown by EQR’s historical average annual portfolio turnover of 13%7, periodically pruning the portfolio of companies we consider overvalued is essential for avoiding poor returns during periods of retrenchment. As for bubblier times, we are sure to leave some gains on the table, but historically, this has become a relatively small price to pay for enhanced long-term returns and protection during lost decades.
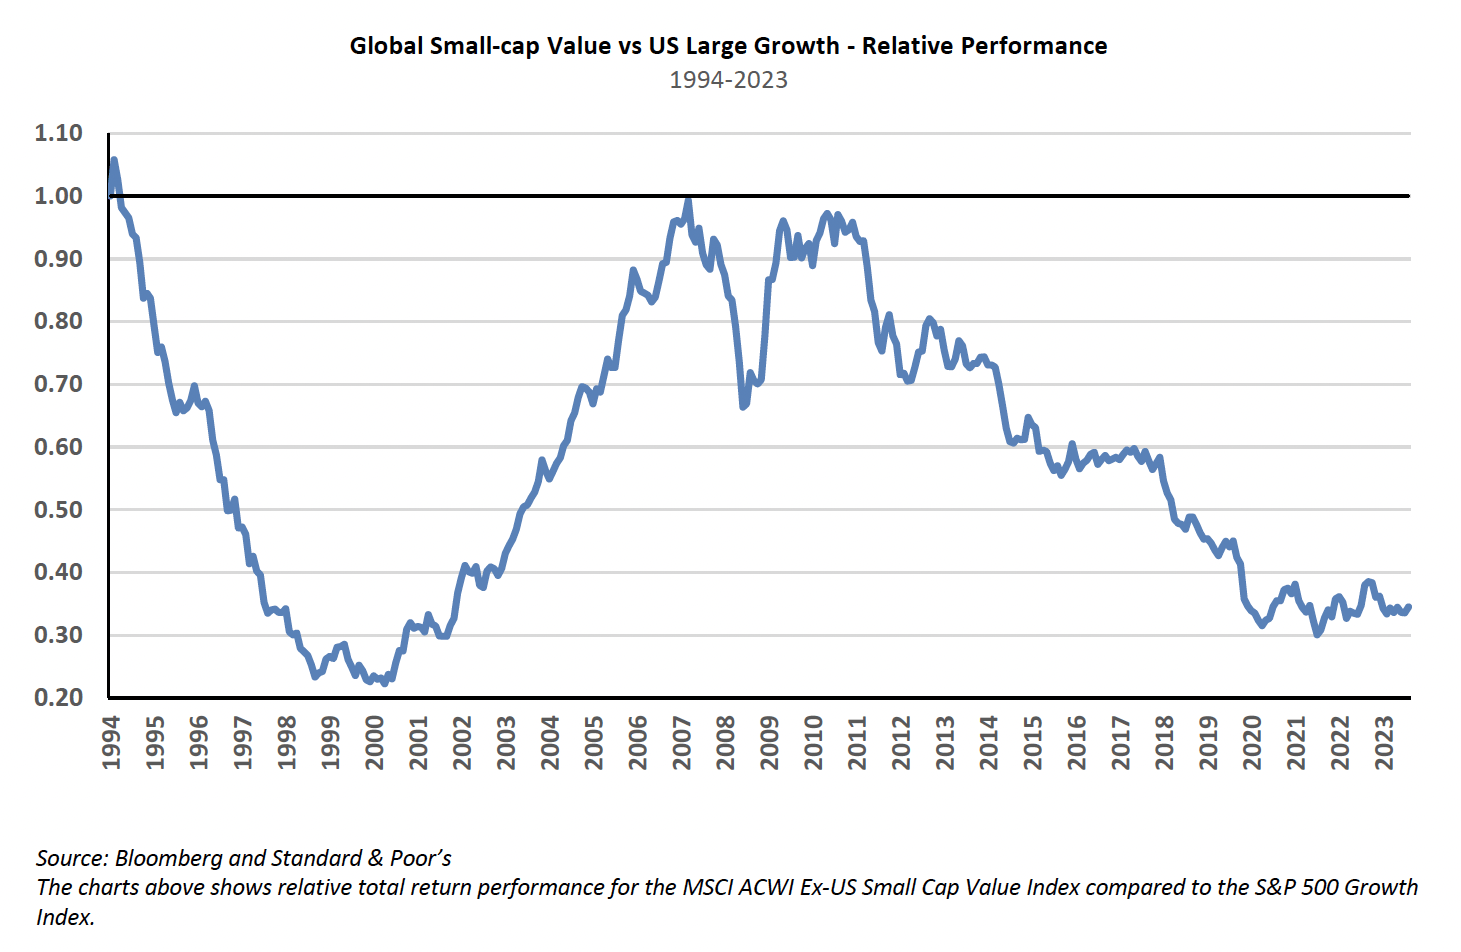
While ACR is not a “style” or “factor” investor, valuation discrepancies in broad asset categories can become more evident at market extremes. The chart above plays on three themes: US versus International, Large versus Small, and Growth versus Value. We would never hang our hat recommending these categories. Yet, based on the attractive valuations we are finding in international small companies and the seemingly high valuations in many US large growth companies, the chart above reflects our company-level analysis well. The relative valuations of certain profitable, unloved companies compared to other, more beloved US leaders appear near historic lows. We believe this trend is likely to reverse again in the coming years.
Industry Icons and Wisdom Gone Wrong
Few things in investing are more American and apple pie than Warren Buffett. ACR investors know our sentiments regarding Warren Buffett, his partner Charlie Munger, and Warren’s mentor Benjamin Graham well. Ben, Warren, and Charlie are like the holy trinity of investment mentors. Charlie’s passing in November saddened us (though it would be vintage Charlie to sardonically comment that at 99, it was a long time coming). Thankfully, Charlie will live as long as “eyes can see.” We heartily recommend the newly updated 2023 edition of Poor Charlie’s Almanack: The Essential Wit and Wisdom of Charles T. Munger.
In the spirit of the independent, iconoclastic thinking championed by Charlie, we would now like to tear down a bit of conventional investment wisdom attributed to these icons and a few others. We begin with Warren, Charlie, and Ben. Investment lore has it that Ben’s penchant for “cigar butts,” companies on their last leg, where you could get a little value for almost nothing like the last puff on a cigar, was cast aside for Charlie’s style of finding outstanding businesses that one could own for many years. As Warren puts it, “Cigar-butt investing was scalable only to a point. With large sums, it would never work well. It took Charlie Munger to break my cigar-butt habits and set the course for building a business that could combine huge size with satisfactory profits.”8 Per Warren, Charlie’s influence also came with a shift toward quality over value: “I revised my strategy and tried to buy good businesses at fair prices rather than fair businesses at good prices.”9
Some Warren and Charlie apostles thus concluded that value was less important than finding great growth companies and narrowed their focus to large, sometimes over-valued, “compounders.” Ironically, Warren Buffett, the unequivocal torch bearer for Ben Graham, the father of value investing, became a perceived champion of so-called growth investing. In the bear market year of 2008, Warren made clear this is not really the case: “Long ago, Ben Graham taught me that ‘Price is what you pay; value is what you get.’ Whether we’re talking about socks or stocks, I like buying quality merchandise when it is marked down.”10 He also clarifies the nonsense so often promulgated about growth versus value: “Market commentators and investment managers who glibly refer to ‘growth’ and ‘value’ styles as contrasting approaches to investment are displaying their ignorance, not their sophistication. Growth is simply a component — usually a plus, sometimes a minus — in the value equation.”11
Companies that can grow for long stretches at double-digit rates via high returns on capital can be enormously valuable. They can also be incredibly cheap, even with high current P/E ratios, if identified before the growth unfolds. Identifying such companies is just as valid an approach as investing in no-growth companies at bargain prices when harvesting and returning cash to shareholders. Investing is a tough job regardless of one’s proclivities for certain types of companies. Knowing how long a company can sustain a high growth rate or harvest its cash flows before going into decline can be very difficult. Our approach at ACR is to open our selection universe to as many types of companies as possible. We welcome compounders and cigar butts alike, large or small. We are just as happy owning one of the Magnificent Seven at the right price, which we do, as we are owning money-good assets in our credit strategy selling for cents on the dollar and working their way through bankruptcy. Our only must-have constraint at the company and security level is quality. Cheap quality is our mantra.
Tellingly, Warren has so little faith that investors can successfully employ any approach to selecting individual stocks that he recommends passive investment in the S&P 500 Index. This should give every budding Warren Buffett acolyte pause. Jack Bogle, the founder of the index fund, is also an industry icon we admire. Passive investing, spurred by Bogle, has become as popular as Warren Buffett, and for good reason. Executed properly, passive investing makes excellent sense. We expound on the virtues and limits of passive investing in our 2016 commentary, Passive Investing and Stock Market Structure. The essential virtue of passive investing is low cost. The vast majority of active investors underperform the market in the long term. Why pay someone to deliver subpar results? In that context, passive investing is the way to go. Yet, there are caveats.
Sound passive investing still requires understanding investment yield. For example, an investor considers the rate offered when buying a CD or bond. You don’t need to be Warren Buffett to know that buying a bunch of 30-year Treasury bonds at a 2% yield may be a bad idea. Remarkably, the leaders of numerous banks and brokerage firms essentially did just that a few years ago. Similarly, if one has just retired, knowing how much a passive stock index will likely earn would be essential. Understanding investment yields in the two broad asset classes of passively managed stocks and bonds is necessary for two reasons: (i) to make intelligent allocation decisions among cash, bonds, and equities, and (ii) to know how much to spend without running out of money. In other words, index investing requires some thought.
Unfortunately, many index investors today appear oblivious to the elevated values and low potential returns embedded in many equity markets, especially in the US. Warren Buffett’s heirs, instructed to invest 10% in cash and 90% in the S&P 50012, will probably make millions a year from a 1½% dividend yield. They can take the risk of waiting ten years for the market to rebound from a nasty decline, but the average retiree and institutional investor cannot. Index investing can be as reckless as individual stock investing, improperly executed. Today, we suspect mindless index investors, driven in more recent years by the explosion in ETFs, are unwittingly driving up many financial asset values, contributing to the high valuations and intra-market valuation discrepancies we point out. The result in the coming years may not be pretty.
Another bit of wisdom gone potentially wrong comes out of a paper by a finance professor and a follow-on research report from a well-known investment strategist (warning: the remainder of this commentary is for deep investment thinkers and prone to cause drowsiness). “Shareholder Wealth Enhancement, 1926 to 2022”, by Hendrik Bessembinder, is a nice piece of historical market scholarship13. Bessembinder reports that “investments in publicly-listed U.S. stocks enhanced shareholder wealth by more than $55.1 trillion in aggregate during the 1926-2022 period, even while investments in the majority (58.6%) of the 28,114 individual stocks led to reduced rather than increased shareholder wealth.” Bessembinder concludes: “This study documents that the degree to which SWC [shareholder wealth creation] is concentrated in relatively few firms is not only striking but continues to increase in recent years.”
In “Birth, Death, and Wealth Creation,” Michael Mauboussin, whose work we follow and admire, further dissects “corporate demographics” with a particular focus on Bessembinder’s work14. Mauboussin concludes: “The skewness in corporate wealth creation suggests two potential investment approaches.
The first is to seek broad diversification in an index fund. If the future is similar to the past, the outperformance of the wealth creators will more than make up for the underperformance of the losers. The second is to build a portfolio that seeks to avoid the wealth destroyers while owning the wealth creators. Bessembinder finds that the wealth creators have certain financial characteristics that are identifiable, albeit difficult to predict.” Surprise, surprise, here they are: “Large increases in net income, rapid asset and sales growth that the company generated internally, a rising return on assets, above-average research and development (R&D) spending, and cash accumulation were among the characteristics of the top wealth creators.” Classic growth company markers.
While Bessembinder’s scholarship is laudable and Mauboussin’s work thought-provoking, we believe Besseminder’s main findings are tautological and Mauboussin’s conclusions potentially misleading. We bring this to the attention of our clients and readers because we can see how pundits quoting snippets from these two pieces could lead some professionals and the public to erroneously conclude that investing in leading companies and so-called growth stocks is essential to investment success. The two papers also contain humbling insights and avenues for future study, which we highlight after our clarifications.
To understand the potential tautology, consider that companies have a lifecycle (which is widely acknowledged and studied), meaning they both live and die. Assuming this is the case, the most valuable wealth creators over the past 96 years will likely be today’s leading companies. Why? Because they have been around long enough for their leading company economics to compound, and must be near the peak of their economic vitality, as value-destroying stasis and decline have not yet set in. Of course, unlike humans, companies can be reborn, though this is rare. Therefore, it should be no surprise, rather much expected, that four of the top five most valuable companies in the study are also among today’s Magnificent Seven leading companies.
Now consider the death of companies. Due to the company life cycle, one would expect that a large proportion of companies would cease to exist over a span as long as 96 years. It follows that many of these companies would end up destroying value during stasis and decline compared to US treasuries, the hurdle rate Bessembinder selects. The life and death of a company ought to be more like a zero-sum game in the end. Businesses naturally go through a value-creating growth cycle, a period of maturation and stagnation, then decline into a value-destroying death cycle. The death cycle is often hidden under the cloak of corporate M&A and segment-reporting musical chairs, but businesses are still dying, and assets are still being reconstituted when possible. The steady drumbeat of innovation and Schumpeterian creative destruction thankfully assures an ever-evolving economy producing ever-higher living standards. A look back at the original Dow Industrial Average of 1896 and the evolution of Dow companies over the years illustrates this point well15.
Thus, two of Bessembinder’s main findings – that a small proportion of leading companies create most of the stock market’s value and that many companies destroy value – are what one would expect from such a survey. Indeed, the surprise would be if there were a different finding. Of course, properly testing a hypothesis is precisely what good scholarship is about, so it is curious that the findings are presented as a surprise rather than a successful test of a reasonable proposition.
Mauboussin’s argument for passive investing is, in our opinion, sound, based on the finding that leading companies create a disproportionate amount of value yet are “difficult to predict.” Passive investment based on market values ought to do a good job of riding out the winners and winding down the losers. The requirement is that market values follow fundamental values reasonably well, which we believe most of the time they do. Yet, there can be trouble when passive and other investors get carried away buying passive funds and leading companies without a sufficient understanding of underlying business value and staying power. The S&P 500 bear market decline of 49% from 2000-02 is the poster child for what happens when prices of leading companies become unmoored from their underlying values. A thoughtful investor ought to be able to identify these extremes, as indicated earlier, and avoid the calamities. The worst debacles are rare, such as investing the entire proceeds of a major liquidity event in the stock market at precisely the wrong time. The more common yet serious problem is when investors believe they have more spending power than they do, until they don’t.
As previously noted, intelligently identifying and investing in leading companies based on assessments of fundamental value is a perfectly viable approach to investing. Yet, this is just one of many potential approaches, whereas Mauboussin seems to suggest just two: index and leading company growth investment. This might be enough if investment was defined as maximizing stock market capitalization. But that is not what investment is. Investment is buying all or parts of profitable businesses at fair or low prices. Many wealthy individuals make small fortunes harvesting income from profitable, slow-growing family businesses. Many successful investments can be made in modestly growing small or mid-sized companies at reasonable prices. And many equal-weighted passive investments today are likely to offer better returns than some of their market-capitalization-weighted brethren. In short, it is easy to read these two papers and erroneously conflate stock market capitalization creation and investor wealth creation. The two are only equivalent in market capitalization-weighted indexes. Otherwise, they are different animals. This leads to our final observation.
Bessembinder and Mauboussin bring into focus hard questions about the veracity of today’s investment valuation tools. Long-form discounted cash flow models and terminal value assumptions require decades of cash flows to produce a full present value. How many companies will be really worth the present value of their cash flows calculated three decades from today? How often are equity investors like us just skillfully riding out a decade or less of visible cash flows in companies that will ultimately decline before the purported value of their long-term cash flows comes to fruition? These are the more interesting and humbling questions that require further thought and exploration.
A more granular study of companies, businesses, assets, and products as they weave their way through corporate structures could help us better understand the nature of the business life cycle. Strategies for harvesting the assets and profits of declining businesses is another potentially fruitful area of study. That over half of companies destroy value is a sober reminder and perhaps illustrative of the agency costs at public companies when management prioritizes unprofitable growth over profitable decline.
The principles of investment are simple. Execution of them is complex. We hope our excursion into investment wisdom gone wrong has helped to clarify our views on key topics like value, growth, passive investment, company life cycles, and the nature of investment success. On behalf of the ACR team, we are grateful for your continued trust and confidence and wish you the best in the coming year.
Nick Tompras
January 2024
End Notes:
1. ACR calculates a fundamental value for each portfolio company based on the cash flows ACR expects the business to generate over its life, discounted by a risk-adjusted discount rate. The aggregate portfolio fundamental value is based on the weighted sum of the fundamental values of the individual holdings. The price-to-value (“PV”) represents the traded market value of the portfolio relative to ACR’s assessment of portfolio fundamental value. The fundamental return of the portfolio represents the annual change in the portfolio’s fundamental value, as measured by the dividend yield + fundamental value growth. Fundamental value growth is intended to estimate the growth in the underlying earnings power of the portfolio of businesses, independent of whether stock prices may have gone up or down during the period.
2. EQR Total Accounts composite annualized total return shown is net of a 1.00% annual fee, the standard management fee for the Equity Quality Return (EQR) strategy, from 1/1/2020 through 12/31/2023. Total Return performance includes unrealized gains, realized gains, dividends, interest, and the re-investment of all income. The client’s return will be reduced by the advisory fees and any other expenses incurred in managing the advisory account. Past performance and current analysis do not guarantee future results. Source: ACR
3. ACR CAPE is based on Real S&P 500 Price Per Share (PPS) divided by Ordinary Least-Squares Regression (OLS) trendline of S&P 500 Real Earnings Per Share (EPS) from 1926 to December 31, 2023. Price as of December 31, 2023; EPS as of December 31, 2023. Sources: S&P Dow Jones Indices; Robert Shiller; BLS- CPI Data; ACR Alpine Capital Research. S&P 500 EPS sourced from Shiller data through March 31, 2023. The most recent S&P 500 TTM EPS estimate as of December 31, 2023, is sourced from Howard Silverblatt.
4. The Global Financial Crisis (GFC) was the most severe worldwide economic downturn since the Great Depression, from mid-2007 to early 2009. Leading up to the GFC increases in the number of subprime mortgages and securitization of mortgage-backed securities created a bubble in the U.S. housing market. When the U.S. housing market collapsed, it caused a widespread economic downturn, precipitating a global recession.
5. Total Return performance includes unrealized gains, realized gains, dividends, interest, and the re-investment of all income. Pure Gross returns are gross of all fees and do not reflect the deduction of transaction costs in wrap portfolios. Pure Gross returns are supplemental information. The client’s return will be reduced by the advisory fees and any other expenses incurred in managing the advisory account. Net of 1% ACR Fee returns are Pure Gross returns reduced by 1.00% per annum, the standard management fee for the Equity Quality Return strategy.
6. The EQR Total Accounts Composite total return (including cash) was 271% from Dec. 31, 2011, to December 31, 2023, pure gross of fees. The dividend return was 26% based on the EQR strategy period dividend yield multiplied by the equity allocation. The portfolio total return and estimated dividend return establish a price return of 195%. The EQR strategy EY based on our company-level earning power estimates was 8.6% (P/E of 11.7) as of Dec. 31, 2011, and 9.7% (P/E of 10.4) as of December 31, 2023. The price growth of 195% and EY increase of 1.1% percentage points result in calculated earnings growth of 233%. EQR company cash earning power estimates were chosen because we believe that they are more accurate and conservative than other earnings measures. Based on as-reported earnings (diluted EPS excl. extra items from S&P Cap IQ), the EQR strategy EY was 7.9% (P/E of 12.6) as of Dec. 31, 2011, and 6.6% (P/E of 15.1) as of December 31, 2023. This results in earnings growth of 217%. As reported, the operating earnings of concentrated portfolios like the EQR strategy often contain distortions that render them less accurate and informative. We believe the EQR cash earning power estimate removes these distortions and is the best representation of earnings for the EQR strategy and this analysis. The S&P 500 Index price return was 279% from Dec. 31, 2011, to December 31, 2023 (total return was 378%). The S&P 500 EY based on trailing 4Q as reported earnings was 6.9% (P/E of 14.5) as of Dec. 31, 2011, and 4.0% (P/E of 24.7) as of December 31, 2023 (TTM 12/31/23 earnings provided by S&P Dow Jones Indices). The price growth of 279% and EY decrease of -2.9% points result in 122% earnings growth. When we first began publishing this study, as reported earnings resulted in the most favorable earnings growth rate for the S&P 500, it was chosen for conservatism. For comparison, operating earnings resulted in 121% earnings growth, and normalized earnings using ACR’s cyclical adjustment method resulted in 65% earnings growth. The EQR strategy and S&P 500 analysis include changes in the underlying companies owned from Dec. 31, 2011, and December 30, 2023. Earnings growth is impacted by both the earnings growth of portfolio companies and changes in portfolio composition. For the EQR portfolio, the analysis shows how changes in portfolio composition – as we “prune” the portfolio of companies we believe are over-valued and replace them with those we believe are under-valued – have captured significant earnings growth.
7. Average Turnover is the percentage of the portfolio’s holdings that have been replaced in a given year (calendar year or whichever 12-month period represents the portfolio’s fiscal year). The ratio seeks to reflect the proportion of stocks that have changed on average since inception.
8. Buffett, Warren. Berkshire Hathaway Letters to Shareholders, 2022 (p. 1735). Explorist Productions. Kindle Edition.
9. Buffett, Warren. Berkshire Hathaway Letters to Shareholders, 2022 (p. 661). Explorist Productions. Kindle Edition.
10. Buffett, Warren. Berkshire Hathaway Letters to Shareholders, 2022 (p. 1389). Explorist Productions. Kindle Edition.
11. Buffett, Warren. Berkshire Hathaway Letters to Shareholders, 2022 (p. 1019). Explorist Productions. Kindle Edition.
12. Buffett, Warren. Berkshire Hathaway Letters to Shareholders, 2022 (p. 1671). Explorist Productions. Kindle Edition.
13. Bessembinder, Hendrik, WP Carey School of Business, Arizona State University, Shareholder Wealth Enhancement, 1926-2022, Current Draft: June 2023.
14. Mauboussin, Michael J. Callahan, Dan, Birth, Death, and Wealth Creation: Why Investors Need to Understand Corporate Demographics, Morgan Stanley Investment Management, July 25, 2023.
15. Dow Jones Industrial Average https://en.wikipedia.org/wiki/Dow_Jones_Industrial_Average
IMPORTANT DISCLOSURES
ACR Alpine Capital Research LLC is an SEC-registered investment adviser. For more information, please refer to Form ADV on file with the SEC at www.adviserinfo.sec.gov. Registration with the SEC does not imply any particular level of skill or training.
Unless otherwise noted, all statistics highlighted in this research note are sourced from ACR’s analysis.
It should not be assumed that recommendations made in the future will be profitable or will equal the performance of the examples discussed. You should consider any strategy’s investment objectives, risks, charges, and expenses carefully before you invest.
This information should not be used as a general guide to investing or as a source of any specific investment recommendations and makes no implied or expressed recommendations concerning the manner in which an account should or would be handled, as appropriate investment strategies depend upon specific investment guidelines and objectives. This is not an offer to sell or a solicitation to invest.
This information is intended solely to report on investment strategies implemented by Alpine Capital Research (“ACR”). Opinions and estimates offered constitute our judgment as of the date set forth above and are subject to change without notice, as are statements of financial market trends, which are based on current market conditions. There are risks associated with purchasing and selling securities and options thereon, including the risk that you could lose money. All material presented is compiled from sources believed to be reliable, but no guarantee is given as to its accuracy.
The investment outlook represents ACR’s views on the economic factors that may affect the global capital markets. There can be no guarantee that these factors will necessarily occur as ACR anticipates, nor that if they do, they will lead to positive performance returns. There can be no assurance that any objective will be achieved.
The Equity Quality Return (EQR) Total Accounts Composite consists of equity portfolios managed for non-wrap fee and wrap fee clients according to the Firm’s published investment policy. The composite investment policy includes the objective of providing satisfactory absolute and relative results in the long run and preserving capital from permanent loss during periods of economic decline. EQR invests only in publicly traded marketable common stocks. Total Return performance includes unrealized gains, realized gains, dividends, interest, and the re-investment of all income. Pure Gross returns are gross of all fees and do not reflect the deduction of transaction costs in wrap portfolios. Pure Gross returns are supplemental information. Net of ACR Fee returns are Pure Gross returns reduced by 1.0% per annum, which is the standard management fee for the Equity Quality Return strategy. Please refer to our full composite performance presentation with disclosures published under the Strategies section of our website at www.acr-invest.com/strategies/eqr-advised-sma-composite.
The S&P 500 TR Index is a broad-based stock index that includes dividend reinvestment and has been presented as an indication of domestic stock market performance. It is unmanaged and cannot be purchased by investors. See EQR’s full composite presentation at www.acr-invest.com/strategies/eqr-advised-sma-composite.
2023 marked a year of outsized stock price gains for the most popular US companies. Regardless of the moniker – The Magnificent Seven, FANGS, or Nifty-Fifty – the well-worn pattern is as old as stock investing. There are always leading companies. The very first was the Dutch East India Company, which was formed in 1602. Typically, leading companies share three characteristics: they have grown for years, are significant and disruptive innovators, and inevitably become popular among investors. Judging whether a company has become too popular is not always easy. What is clear is that the US equity market marched higher last year on the back of the Magnificent Seven. The main message of our 2023 commentary is that ownership of leading companies is not necessary for investment success, and the results from investing in them can be disappointing at the wrong price.
The market value of our equity strategies rose significantly faster last year than our companies’ underlying earnings and fundamental values. We believe the prices of our companies rose from very attractive lows while their fundamental values progressed at a steady pace. The estimated fundamental return of our flagship Equity Quality Return (“EQR”) strategy was 9.7% last year, while the price/value of the portfolio rose from 0.71 to 0.811. This compares to a price/value historical average of 0.84 since 2003. ACR’s investment results can be found at www.acr-invest.com/strategies.
Context and Conditions
The decade of the 2020s has been eventful so far, to say the least: pandemic, recession, inflation, political unrest, rising rates, two bear markets, two wars, and two bull markets. Yet, while so much happened, it seems like 2019 was yesterday. Statistically, the US equity market has been in a valuation time warp, ending roughly where it began. The following observation appears apropos circa 2019 and 2023: general equity market prices are historically high, and a small group of companies remain comparatively cheap. While there are no guarantees, the consequences are likely two-fold: EQR earns returns consistent with past results, whereas equity markets earn mid-single-digit returns with the risk of a lost decade.
We are not, however, sitting around waiting for markets to adjust. Instead, we own companies that are converting corporate profits into dividends and realized gains now. This decade, the total annualized return for EQR and the S&P 500 was coincidentally 12.0% per year2. Our estimates also show that the S&P 500 cyclically adjusted P/E rose from 32.7 to 37.0 over these four years, whereas EQR’s cyclically adjusted P/E declined from 10.9 to 10.43. In other words, the S&P 500’s 12% return was likely earned with rising valuation risk, while our analysis shows that EQR’s 12% net return was not. This is not a new story, of course. Our update of two familiar charts will help to illustrate the point.
Prices have been rising faster than earnings for decades. The chart above shows the phenomenon back to 1989. This period has particular significance for ACR’s founder, who started in the investment business full-time in 1990. The folly of dividing investment returns into months, quarters, or even a few years is that an entire investment career may only encompass three or four discrete periods. The past three decades in US equities can be characterized by three markets: the 1990s Internet bubble, the 2000s valuation and GFC4 retrenchments, and the 2010s liquidity recovery bubble. We are not really sure what to call the 2010s and 20s yet. Our label acknowledges the period’s unprecedented Fed balance sheet expansion, which could be a key driver of higher financial asset prices beyond just plain buying without awareness of fundamental value or return. The eventful 2020s have surprisingly extended the bubbly prices of the 2010s to today.
While the goods and services economy and financial markets are connected economically, the dynamics don’t always align. For example, the equity market rise during the housing bubble, culminating in the GFC, was overshadowed in the 2000s by the valuation and GFC bear markets. Another recent example is that valuation multiples have contracted somewhat in interest rate-sensitive asset classes such as private equity and real estate (when clearing), even as they remain buoyant in public equity markets as measured by indexes like the S&P 500.
Again, ACR is not waiting for an equity market adjustment or retrenchment. EQR results have been consistent through both bubbles and retrenchments5. One critical reason is our penchant for risk control. The ACR investment team is keen to understand systemic, industry, and company fragilities and imbalances. For example, our analysis of broader economic and market characteristics helped us avoid tech stocks in the early 2000s and financials in the mid-2000s. That said, while seeking to understand systemic economic issues, our buy-and-sell decisions are never made based on “top-down” forecasts of macroeconomic variables such as employment, inflation, or interest rates. Instead, our bottom-up valuations are informed by corporate performance estimates adjusted for an appropriately wide range of relevant economic outcomes. In recent years, which echo the late 1990s, the most significant systemic economic risk appears to be high-tech-driven valuations rather than underlying economic or financial system fragility. Yet, there is enough entity level over-indebtedness, some of it tied to insufficient asset yields, that a more pedestrian recession could spiral into a harder landing, producing a good deal of economic pain, and opportunity.
The chart above shows price and earnings development for EQR and the S&P 500 from 2012 to 20236. Note that earnings development includes both the earnings growth generated by our portfolio companies and the value captured by replacing higher-priced with lower-priced holdings. While we don’t do a lot of buying and selling, as shown by EQR’s historical average annual portfolio turnover of 13%7, periodically pruning the portfolio of companies we consider overvalued is essential for avoiding poor returns during periods of retrenchment. As for bubblier times, we are sure to leave some gains on the table, but historically, this has become a relatively small price to pay for enhanced long-term returns and protection during lost decades.
While ACR is not a “style” or “factor” investor, valuation discrepancies in broad asset categories can become more evident at market extremes. The chart above plays on three themes: US versus International, Large versus Small, and Growth versus Value. We would never hang our hat recommending these categories. Yet, based on the attractive valuations we are finding in international small companies and the seemingly high valuations in many US large growth companies, the chart above reflects our company-level analysis well. The relative valuations of certain profitable, unloved companies compared to other, more beloved US leaders appear near historic lows. We believe this trend is likely to reverse again in the coming years.
Industry Icons and Wisdom Gone Wrong
Few things in investing are more American and apple pie than Warren Buffett. ACR investors know our sentiments regarding Warren Buffett, his partner Charlie Munger, and Warren’s mentor Benjamin Graham well. Ben, Warren, and Charlie are like the holy trinity of investment mentors. Charlie’s passing in November saddened us (though it would be vintage Charlie to sardonically comment that at 99, it was a long time coming). Thankfully, Charlie will live as long as “eyes can see.” We heartily recommend the newly updated 2023 edition of Poor Charlie’s Almanack: The Essential Wit and Wisdom of Charles T. Munger.
In the spirit of the independent, iconoclastic thinking championed by Charlie, we would now like to tear down a bit of conventional investment wisdom attributed to these icons and a few others. We begin with Warren, Charlie, and Ben. Investment lore has it that Ben’s penchant for “cigar butts,” companies on their last leg, where you could get a little value for almost nothing like the last puff on a cigar, was cast aside for Charlie’s style of finding outstanding businesses that one could own for many years. As Warren puts it, “Cigar-butt investing was scalable only to a point. With large sums, it would never work well. It took Charlie Munger to break my cigar-butt habits and set the course for building a business that could combine huge size with satisfactory profits.”8 Per Warren, Charlie’s influence also came with a shift toward quality over value: “I revised my strategy and tried to buy good businesses at fair prices rather than fair businesses at good prices.”9
Some Warren and Charlie apostles thus concluded that value was less important than finding great growth companies and narrowed their focus to large, sometimes over-valued, “compounders.” Ironically, Warren Buffett, the unequivocal torch bearer for Ben Graham, the father of value investing, became a perceived champion of so-called growth investing. In the bear market year of 2008, Warren made clear this is not really the case: “Long ago, Ben Graham taught me that ‘Price is what you pay; value is what you get.’ Whether we’re talking about socks or stocks, I like buying quality merchandise when it is marked down.”10 He also clarifies the nonsense so often promulgated about growth versus value: “Market commentators and investment managers who glibly refer to ‘growth’ and ‘value’ styles as contrasting approaches to investment are displaying their ignorance, not their sophistication. Growth is simply a component — usually a plus, sometimes a minus — in the value equation.”11
Companies that can grow for long stretches at double-digit rates via high returns on capital can be enormously valuable. They can also be incredibly cheap, even with high current P/E ratios, if identified before the growth unfolds. Identifying such companies is just as valid an approach as investing in no-growth companies at bargain prices when harvesting and returning cash to shareholders. Investing is a tough job regardless of one’s proclivities for certain types of companies. Knowing how long a company can sustain a high growth rate or harvest its cash flows before going into decline can be very difficult. Our approach at ACR is to open our selection universe to as many types of companies as possible. We welcome compounders and cigar butts alike, large or small. We are just as happy owning one of the Magnificent Seven at the right price, which we do, as we are owning money-good assets in our credit strategy selling for cents on the dollar and working their way through bankruptcy. Our only must-have constraint at the company and security level is quality. Cheap quality is our mantra.
Tellingly, Warren has so little faith that investors can successfully employ any approach to selecting individual stocks that he recommends passive investment in the S&P 500 Index. This should give every budding Warren Buffett acolyte pause. Jack Bogle, the founder of the index fund, is also an industry icon we admire. Passive investing, spurred by Bogle, has become as popular as Warren Buffett, and for good reason. Executed properly, passive investing makes excellent sense. We expound on the virtues and limits of passive investing in our 2016 commentary, Passive Investing and Stock Market Structure. The essential virtue of passive investing is low cost. The vast majority of active investors underperform the market in the long term. Why pay someone to deliver subpar results? In that context, passive investing is the way to go. Yet, there are caveats.
Sound passive investing still requires understanding investment yield. For example, an investor considers the rate offered when buying a CD or bond. You don’t need to be Warren Buffett to know that buying a bunch of 30-year Treasury bonds at a 2% yield may be a bad idea. Remarkably, the leaders of numerous banks and brokerage firms essentially did just that a few years ago. Similarly, if one has just retired, knowing how much a passive stock index will likely earn would be essential. Understanding investment yields in the two broad asset classes of passively managed stocks and bonds is necessary for two reasons: (i) to make intelligent allocation decisions among cash, bonds, and equities, and (ii) to know how much to spend without running out of money. In other words, index investing requires some thought.
Unfortunately, many index investors today appear oblivious to the elevated values and low potential returns embedded in many equity markets, especially in the US. Warren Buffett’s heirs, instructed to invest 10% in cash and 90% in the S&P 50012, will probably make millions a year from a 1½% dividend yield. They can take the risk of waiting ten years for the market to rebound from a nasty decline, but the average retiree and institutional investor cannot. Index investing can be as reckless as individual stock investing, improperly executed. Today, we suspect mindless index investors, driven in more recent years by the explosion in ETFs, are unwittingly driving up many financial asset values, contributing to the high valuations and intra-market valuation discrepancies we point out. The result in the coming years may not be pretty.
Another bit of wisdom gone potentially wrong comes out of a paper by a finance professor and a follow-on research report from a well-known investment strategist (warning: the remainder of this commentary is for deep investment thinkers and prone to cause drowsiness). “Shareholder Wealth Enhancement, 1926 to 2022”, by Hendrik Bessembinder, is a nice piece of historical market scholarship13. Bessembinder reports that “investments in publicly-listed U.S. stocks enhanced shareholder wealth by more than $55.1 trillion in aggregate during the 1926-2022 period, even while investments in the majority (58.6%) of the 28,114 individual stocks led to reduced rather than increased shareholder wealth.” Bessembinder concludes: “This study documents that the degree to which SWC [shareholder wealth creation] is concentrated in relatively few firms is not only striking but continues to increase in recent years.”
In “Birth, Death, and Wealth Creation,” Michael Mauboussin, whose work we follow and admire, further dissects “corporate demographics” with a particular focus on Bessembinder’s work14. Mauboussin concludes: “The skewness in corporate wealth creation suggests two potential investment approaches.
The first is to seek broad diversification in an index fund. If the future is similar to the past, the outperformance of the wealth creators will more than make up for the underperformance of the losers. The second is to build a portfolio that seeks to avoid the wealth destroyers while owning the wealth creators. Bessembinder finds that the wealth creators have certain financial characteristics that are identifiable, albeit difficult to predict.” Surprise, surprise, here they are: “Large increases in net income, rapid asset and sales growth that the company generated internally, a rising return on assets, above-average research and development (R&D) spending, and cash accumulation were among the characteristics of the top wealth creators.” Classic growth company markers.
While Bessembinder’s scholarship is laudable and Mauboussin’s work thought-provoking, we believe Besseminder’s main findings are tautological and Mauboussin’s conclusions potentially misleading. We bring this to the attention of our clients and readers because we can see how pundits quoting snippets from these two pieces could lead some professionals and the public to erroneously conclude that investing in leading companies and so-called growth stocks is essential to investment success. The two papers also contain humbling insights and avenues for future study, which we highlight after our clarifications.
To understand the potential tautology, consider that companies have a lifecycle (which is widely acknowledged and studied), meaning they both live and die. Assuming this is the case, the most valuable wealth creators over the past 96 years will likely be today’s leading companies. Why? Because they have been around long enough for their leading company economics to compound, and must be near the peak of their economic vitality, as value-destroying stasis and decline have not yet set in. Of course, unlike humans, companies can be reborn, though this is rare. Therefore, it should be no surprise, rather much expected, that four of the top five most valuable companies in the study are also among today’s Magnificent Seven leading companies.
Now consider the death of companies. Due to the company life cycle, one would expect that a large proportion of companies would cease to exist over a span as long as 96 years. It follows that many of these companies would end up destroying value during stasis and decline compared to US treasuries, the hurdle rate Bessembinder selects. The life and death of a company ought to be more like a zero-sum game in the end. Businesses naturally go through a value-creating growth cycle, a period of maturation and stagnation, then decline into a value-destroying death cycle. The death cycle is often hidden under the cloak of corporate M&A and segment-reporting musical chairs, but businesses are still dying, and assets are still being reconstituted when possible. The steady drumbeat of innovation and Schumpeterian creative destruction thankfully assures an ever-evolving economy producing ever-higher living standards. A look back at the original Dow Industrial Average of 1896 and the evolution of Dow companies over the years illustrates this point well15.
Thus, two of Bessembinder’s main findings – that a small proportion of leading companies create most of the stock market’s value and that many companies destroy value – are what one would expect from such a survey. Indeed, the surprise would be if there were a different finding. Of course, properly testing a hypothesis is precisely what good scholarship is about, so it is curious that the findings are presented as a surprise rather than a successful test of a reasonable proposition.
Mauboussin’s argument for passive investing is, in our opinion, sound, based on the finding that leading companies create a disproportionate amount of value yet are “difficult to predict.” Passive investment based on market values ought to do a good job of riding out the winners and winding down the losers. The requirement is that market values follow fundamental values reasonably well, which we believe most of the time they do. Yet, there can be trouble when passive and other investors get carried away buying passive funds and leading companies without a sufficient understanding of underlying business value and staying power. The S&P 500 bear market decline of 49% from 2000-02 is the poster child for what happens when prices of leading companies become unmoored from their underlying values. A thoughtful investor ought to be able to identify these extremes, as indicated earlier, and avoid the calamities. The worst debacles are rare, such as investing the entire proceeds of a major liquidity event in the stock market at precisely the wrong time. The more common yet serious problem is when investors believe they have more spending power than they do, until they don’t.
As previously noted, intelligently identifying and investing in leading companies based on assessments of fundamental value is a perfectly viable approach to investing. Yet, this is just one of many potential approaches, whereas Mauboussin seems to suggest just two: index and leading company growth investment. This might be enough if investment was defined as maximizing stock market capitalization. But that is not what investment is. Investment is buying all or parts of profitable businesses at fair or low prices. Many wealthy individuals make small fortunes harvesting income from profitable, slow-growing family businesses. Many successful investments can be made in modestly growing small or mid-sized companies at reasonable prices. And many equal-weighted passive investments today are likely to offer better returns than some of their market-capitalization-weighted brethren. In short, it is easy to read these two papers and erroneously conflate stock market capitalization creation and investor wealth creation. The two are only equivalent in market capitalization-weighted indexes. Otherwise, they are different animals. This leads to our final observation.
Bessembinder and Mauboussin bring into focus hard questions about the veracity of today’s investment valuation tools. Long-form discounted cash flow models and terminal value assumptions require decades of cash flows to produce a full present value. How many companies will be really worth the present value of their cash flows calculated three decades from today? How often are equity investors like us just skillfully riding out a decade or less of visible cash flows in companies that will ultimately decline before the purported value of their long-term cash flows comes to fruition? These are the more interesting and humbling questions that require further thought and exploration.
A more granular study of companies, businesses, assets, and products as they weave their way through corporate structures could help us better understand the nature of the business life cycle. Strategies for harvesting the assets and profits of declining businesses is another potentially fruitful area of study. That over half of companies destroy value is a sober reminder and perhaps illustrative of the agency costs at public companies when management prioritizes unprofitable growth over profitable decline.
The principles of investment are simple. Execution of them is complex. We hope our excursion into investment wisdom gone wrong has helped to clarify our views on key topics like value, growth, passive investment, company life cycles, and the nature of investment success. On behalf of the ACR team, we are grateful for your continued trust and confidence and wish you the best in the coming year.
Nick Tompras
January 2024
End Notes:
1. ACR calculates a fundamental value for each portfolio company based on the cash flows ACR expects the business to generate over its life, discounted by a risk-adjusted discount rate. The aggregate portfolio fundamental value is based on the weighted sum of the fundamental values of the individual holdings. The price-to-value (“PV”) represents the traded market value of the portfolio relative to ACR’s assessment of portfolio fundamental value. The fundamental return of the portfolio represents the annual change in the portfolio’s fundamental value, as measured by the dividend yield + fundamental value growth. Fundamental value growth is intended to estimate the growth in the underlying earnings power of the portfolio of businesses, independent of whether stock prices may have gone up or down during the period.
2. EQR Total Accounts composite annualized total return shown is net of a 1.00% annual fee, the standard management fee for the Equity Quality Return (EQR) strategy, from 1/1/2020 through 12/31/2023. Total Return performance includes unrealized gains, realized gains, dividends, interest, and the re-investment of all income. The client’s return will be reduced by the advisory fees and any other expenses incurred in managing the advisory account. Past performance and current analysis do not guarantee future results. Source: ACR
3. ACR CAPE is based on Real S&P 500 Price Per Share (PPS) divided by Ordinary Least-Squares Regression (OLS) trendline of S&P 500 Real Earnings Per Share (EPS) from 1926 to December 31, 2023. Price as of December 31, 2023; EPS as of December 31, 2023. Sources: S&P Dow Jones Indices; Robert Shiller; BLS- CPI Data; ACR Alpine Capital Research. S&P 500 EPS sourced from Shiller data through March 31, 2023. The most recent S&P 500 TTM EPS estimate as of December 31, 2023, is sourced from Howard Silverblatt.
4. The Global Financial Crisis (GFC) was the most severe worldwide economic downturn since the Great Depression, from mid-2007 to early 2009. Leading up to the GFC increases in the number of subprime mortgages and securitization of mortgage-backed securities created a bubble in the U.S. housing market. When the U.S. housing market collapsed, it caused a widespread economic downturn, precipitating a global recession.
5. Total Return performance includes unrealized gains, realized gains, dividends, interest, and the re-investment of all income. Pure Gross returns are gross of all fees and do not reflect the deduction of transaction costs in wrap portfolios. Pure Gross returns are supplemental information. The client’s return will be reduced by the advisory fees and any other expenses incurred in managing the advisory account. Net of 1% ACR Fee returns are Pure Gross returns reduced by 1.00% per annum, the standard management fee for the Equity Quality Return strategy.
6. The EQR Total Accounts Composite total return (including cash) was 271% from Dec. 31, 2011, to December 31, 2023, pure gross of fees. The dividend return was 26% based on the EQR strategy period dividend yield multiplied by the equity allocation. The portfolio total return and estimated dividend return establish a price return of 195%. The EQR strategy EY based on our company-level earning power estimates was 8.6% (P/E of 11.7) as of Dec. 31, 2011, and 9.7% (P/E of 10.4) as of December 31, 2023. The price growth of 195% and EY increase of 1.1% percentage points result in calculated earnings growth of 233%. EQR company cash earning power estimates were chosen because we believe that they are more accurate and conservative than other earnings measures. Based on as-reported earnings (diluted EPS excl. extra items from S&P Cap IQ), the EQR strategy EY was 7.9% (P/E of 12.6) as of Dec. 31, 2011, and 6.6% (P/E of 15.1) as of December 31, 2023. This results in earnings growth of 217%. As reported, the operating earnings of concentrated portfolios like the EQR strategy often contain distortions that render them less accurate and informative. We believe the EQR cash earning power estimate removes these distortions and is the best representation of earnings for the EQR strategy and this analysis. The S&P 500 Index price return was 279% from Dec. 31, 2011, to December 31, 2023 (total return was 378%). The S&P 500 EY based on trailing 4Q as reported earnings was 6.9% (P/E of 14.5) as of Dec. 31, 2011, and 4.0% (P/E of 24.7) as of December 31, 2023 (TTM 12/31/23 earnings provided by S&P Dow Jones Indices). The price growth of 279% and EY decrease of -2.9% points result in 122% earnings growth. When we first began publishing this study, as reported earnings resulted in the most favorable earnings growth rate for the S&P 500, it was chosen for conservatism. For comparison, operating earnings resulted in 121% earnings growth, and normalized earnings using ACR’s cyclical adjustment method resulted in 65% earnings growth. The EQR strategy and S&P 500 analysis include changes in the underlying companies owned from Dec. 31, 2011, and December 30, 2023. Earnings growth is impacted by both the earnings growth of portfolio companies and changes in portfolio composition. For the EQR portfolio, the analysis shows how changes in portfolio composition – as we “prune” the portfolio of companies we believe are over-valued and replace them with those we believe are under-valued – have captured significant earnings growth.
7. Average Turnover is the percentage of the portfolio’s holdings that have been replaced in a given year (calendar year or whichever 12-month period represents the portfolio’s fiscal year). The ratio seeks to reflect the proportion of stocks that have changed on average since inception.
8. Buffett, Warren. Berkshire Hathaway Letters to Shareholders, 2022 (p. 1735). Explorist Productions. Kindle Edition.
9. Buffett, Warren. Berkshire Hathaway Letters to Shareholders, 2022 (p. 661). Explorist Productions. Kindle Edition.
10. Buffett, Warren. Berkshire Hathaway Letters to Shareholders, 2022 (p. 1389). Explorist Productions. Kindle Edition.
11. Buffett, Warren. Berkshire Hathaway Letters to Shareholders, 2022 (p. 1019). Explorist Productions. Kindle Edition.
12. Buffett, Warren. Berkshire Hathaway Letters to Shareholders, 2022 (p. 1671). Explorist Productions. Kindle Edition.
13. Bessembinder, Hendrik, WP Carey School of Business, Arizona State University, Shareholder Wealth Enhancement, 1926-2022, Current Draft: June 2023.
14. Mauboussin, Michael J. Callahan, Dan, Birth, Death, and Wealth Creation: Why Investors Need to Understand Corporate Demographics, Morgan Stanley Investment Management, July 25, 2023.
15. Dow Jones Industrial Average https://en.wikipedia.org/wiki/Dow_Jones_Industrial_Average
IMPORTANT DISCLOSURES
ACR Alpine Capital Research LLC is an SEC-registered investment adviser. For more information, please refer to Form ADV on file with the SEC at www.adviserinfo.sec.gov. Registration with the SEC does not imply any particular level of skill or training.
Unless otherwise noted, all statistics highlighted in this research note are sourced from ACR’s analysis.
It should not be assumed that recommendations made in the future will be profitable or will equal the performance of the examples discussed. You should consider any strategy’s investment objectives, risks, charges, and expenses carefully before you invest.
This information should not be used as a general guide to investing or as a source of any specific investment recommendations and makes no implied or expressed recommendations concerning the manner in which an account should or would be handled, as appropriate investment strategies depend upon specific investment guidelines and objectives. This is not an offer to sell or a solicitation to invest.
This information is intended solely to report on investment strategies implemented by Alpine Capital Research (“ACR”). Opinions and estimates offered constitute our judgment as of the date set forth above and are subject to change without notice, as are statements of financial market trends, which are based on current market conditions. There are risks associated with purchasing and selling securities and options thereon, including the risk that you could lose money. All material presented is compiled from sources believed to be reliable, but no guarantee is given as to its accuracy.
The investment outlook represents ACR’s views on the economic factors that may affect the global capital markets. There can be no guarantee that these factors will necessarily occur as ACR anticipates, nor that if they do, they will lead to positive performance returns. There can be no assurance that any objective will be achieved.
The Equity Quality Return (EQR) Total Accounts Composite consists of equity portfolios managed for non-wrap fee and wrap fee clients according to the Firm’s published investment policy. The composite investment policy includes the objective of providing satisfactory absolute and relative results in the long run and preserving capital from permanent loss during periods of economic decline. EQR invests only in publicly traded marketable common stocks. Total Return performance includes unrealized gains, realized gains, dividends, interest, and the re-investment of all income. Pure Gross returns are gross of all fees and do not reflect the deduction of transaction costs in wrap portfolios. Pure Gross returns are supplemental information. Net of ACR Fee returns are Pure Gross returns reduced by 1.0% per annum, which is the standard management fee for the Equity Quality Return strategy. Please refer to our full composite performance presentation with disclosures published under the Strategies section of our website at www.acr-invest.com/strategies/eqr-advised-sma-composite.
The S&P 500 TR Index is a broad-based stock index that includes dividend reinvestment and has been presented as an indication of domestic stock market performance. It is unmanaged and cannot be purchased by investors. See EQR’s full composite presentation at www.acr-invest.com/strategies/eqr-advised-sma-composite.
More Posts
Key Topics to Discuss with Your Children About Generational Wealth
Three Things That Can Address Your Wealth Worries
Why Your Charitable Giving Shouldn’t Wait Until Year End
Alpine Private Wealth Unveils New Brand, Reaches $1 Billion in Assets